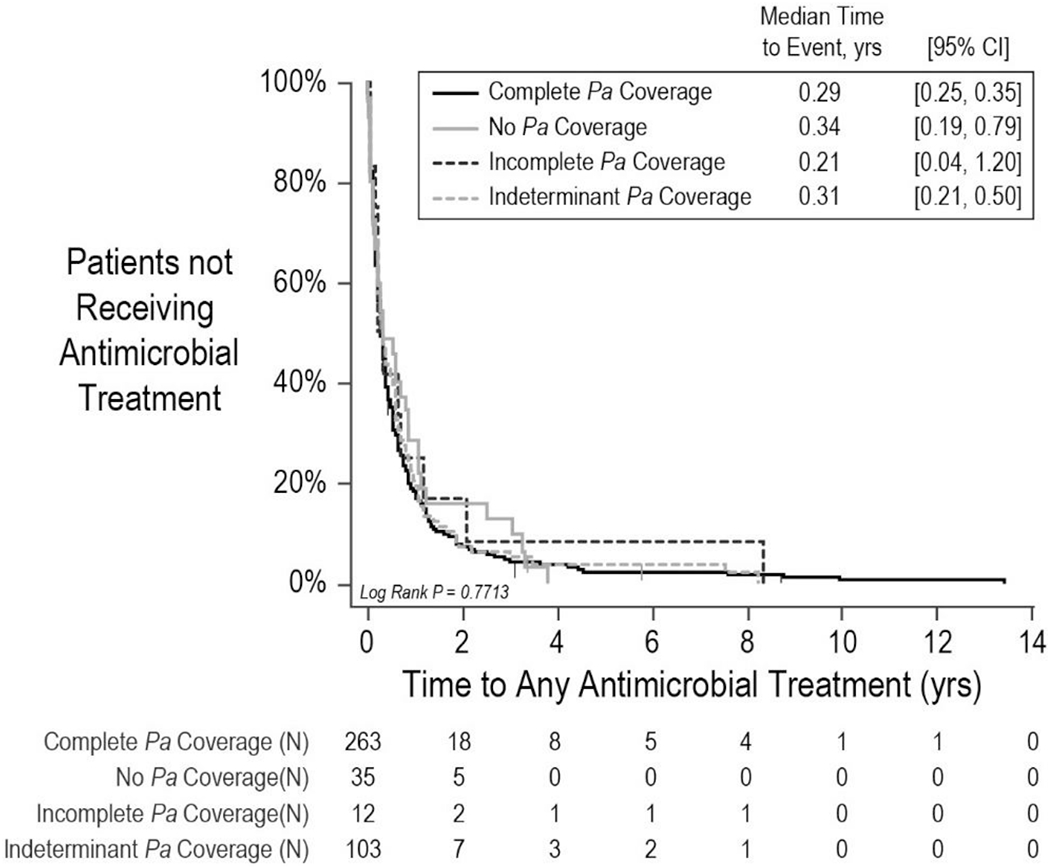
Figure 4. Time to next antimicrobial treatment by Pa coverage category.

Solid black line, patients with complete Pa coverage. Solid gray line, patients with no Pa coverage. Dashed black line, patients with incomplete Pa coverage. Dashed gray line, patients with indeterminant Pa coverage. Numbers of patients at risk are shown below. CI, confidence interval.
