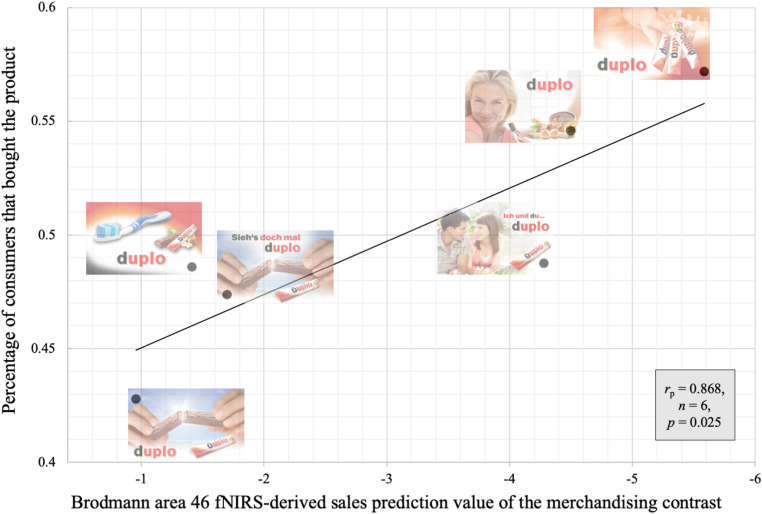
FIGURE 6.
Scatterplot depicting the association between the Brodmann area 46 fNIRS-derived sales prediction value of the merchandising contrast, and actual product sales (Kühn et al., 2016) expressed in percentage of the customers that bought the product on the display with the merchandising element. Pearson correlation presented in the grey box.

