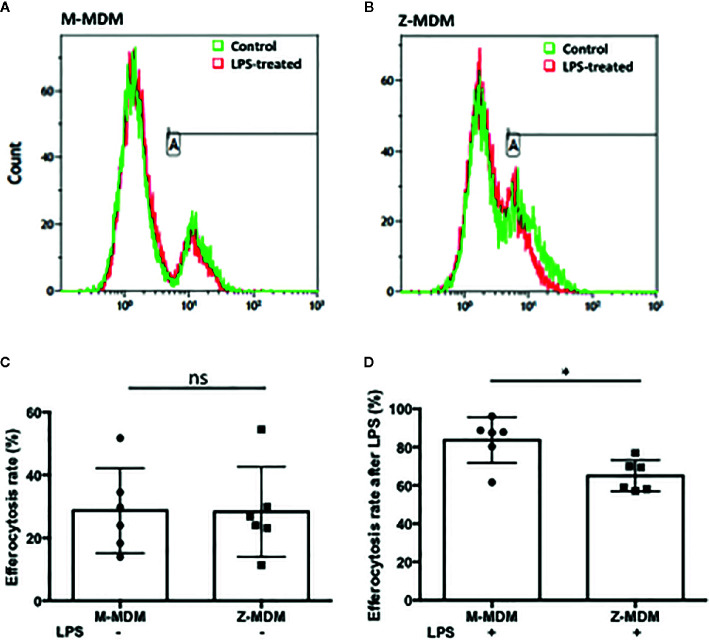
Figure 5.
Efferocytosis of apoptotic neutrophils by M- and Z-MDMs. MDMs were incubated with LPS (10 ng/ml) overnight and celltracker red-labeled apoptotic neutrophils were added to the MDM culture. Efferocytosis of the apoptotic cells by MDMs was assessed by flow cytometric analysis (A) M-MDM (B) Z-MDM. In each histogram plot, the green and red graphs indicate control and LPS-treated MDMs, respectively. The first peak of the each graph indicates non-phagocytosing MDM population and the second peak indicates phagocytosing MDM population. (C) The efferocytosis rates of MDM controls were assessed by flow cytometric analysis; n=6. (D) Efferocytosis rates of LPS-treated MDMs are expressed relative to those of MDM controls that are set to 100%; n=6. *Denotes statistical significance (p-value < 0.05) according to two-tailed Student’s t-test.

