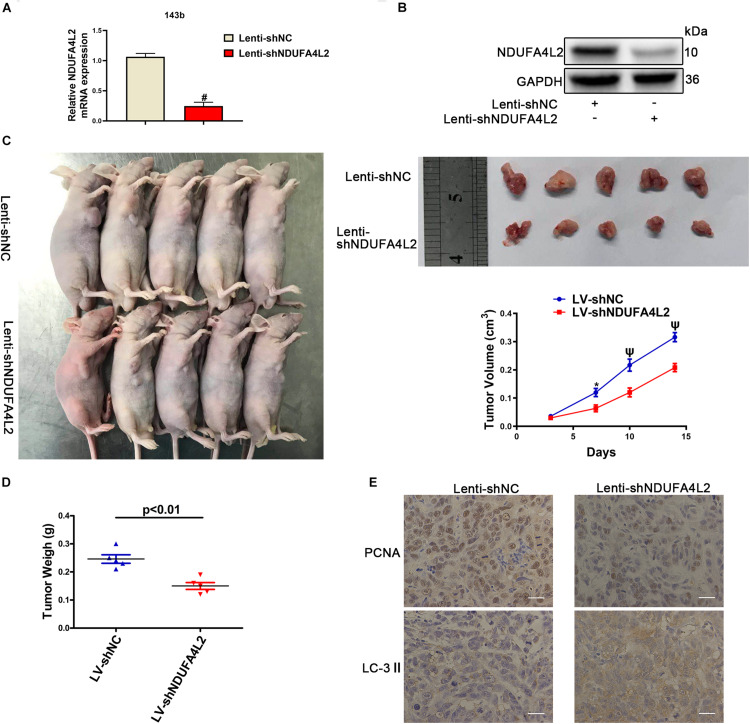
FIGURE 6.
NDUFA4L2 knockdown repressed OS tumor growth in vivo. (A) The levels of expression of NDUFA4L2 mRNA were detected by using qRT-PCR (n = 5). (B) NDUFA4L2 protein expression was determined by Western blotting (n = 5). (C) Results for nude mice carrying tumors from 143b/LV-shNDUFA4L2 and 143b/LV-shNC groups were characterized. Tumor growth curves were assessed weekly (n = 5). (D) Tumor weight from 143b/LV-shNDUFA4L2 and 143b/LV-shNC groups were characterized (n = 5). (E) PCNA and LC3 protein expression was determined by using immunohistochemical staining (n = 5). nsp ≥ 0.05, ∗p < 0.05, ψ < 0.01, and # < 0.001 were defined as measures that indicated significant differences among treatment groups.

