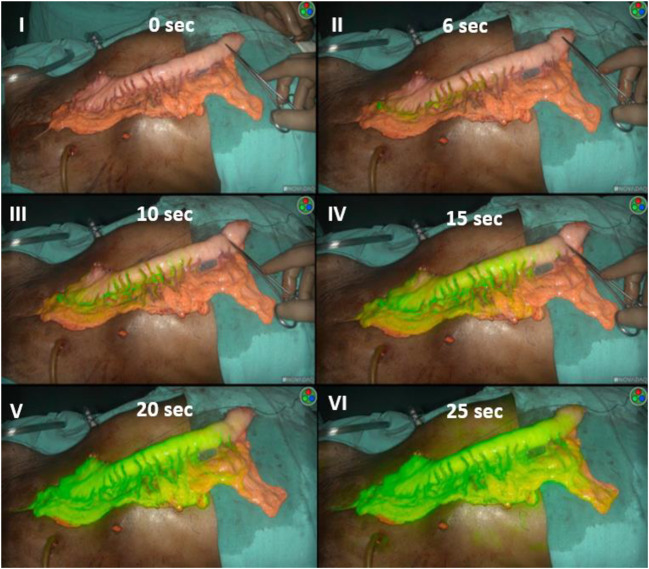
Fig. 2.
Panel no. 1 shows vascularity of gastric conduit assessed under white light. Part of conduit proximal to artery forceps is dusky with doubtful vascularity. Panels II to VI depict the perfusion of conduit at different intervals of time as assessed by ICG fluorescence angiography. Panel II shows first appearance of ICG blush along the arterial arcade at 6 s of injection, whereas panel VI depicts, at 25 s the entire conduit enhancing with ICG fluorescence except its proximal 2 cm nonenhancing part corresponding to same area as visualized under white light

