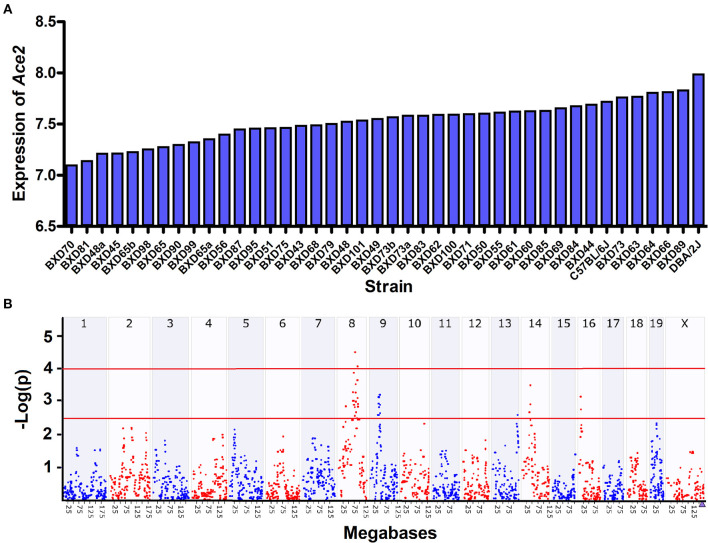
Figure 2.
Expression and eQTL mapping of Ace2 in BXD family. (A) Bar plots of the Ace2 expression levels of heart across the BXD mice. The x-axis shows the BXD strains and the two parental strains. The y-axis shows the normalized log2 expression levels of Ace2. (B) Manhattan plot of genome-wide Ace2-regulated genomic loci. The x-axis denotes a position on the mouse genome, in megabases (Mb), while the y-axis gives the –log (p), a measurement of the linkage between Ace2 expression, and genomic region. The purple triangle indicates the genomic position of Ace2. The red line indicates suggestive (–log (p) of 2.5) and significant (–log (p) of 4.0) genome-wide thresholds. eQTL mapping was conducted with GEMMA on GN.

