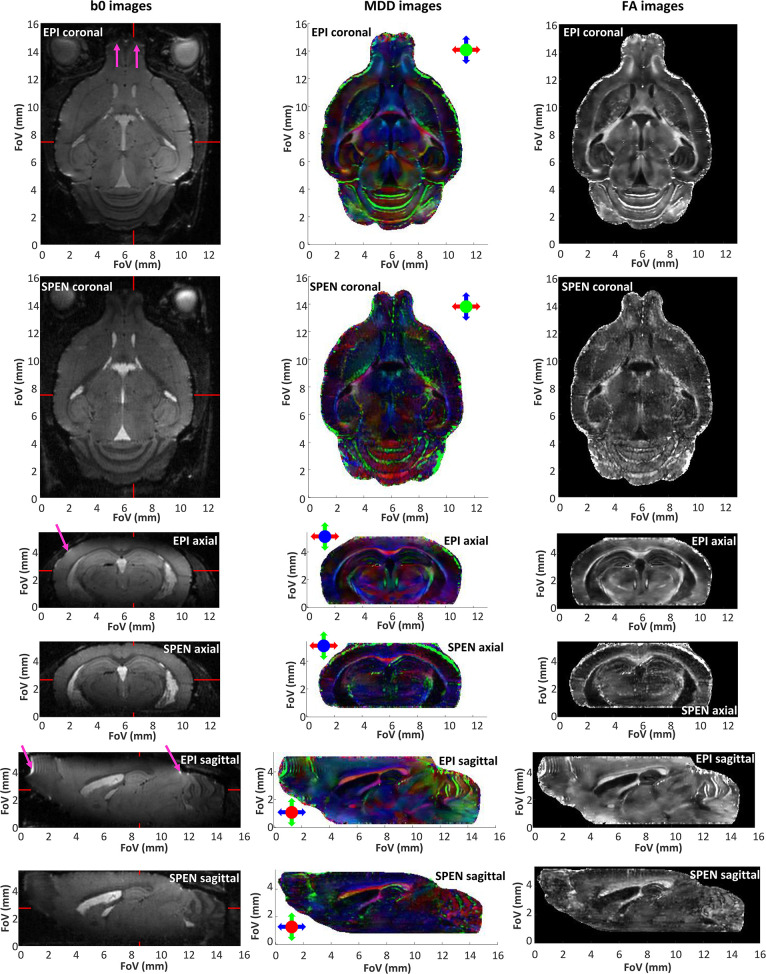
Figure 2.
Non-weighted (b0), color-coded main diffusion directions (MDDs), and fractional anisotropy (FA) images extracted from 3D in vivo brain data obtained by interleaved SPEN (5 segments, 2 scans) and SE-EPI with double sampling (10 segments, 1 scan). All 3D data were collected with a cryocoil at 15.2 T with a 135 μm nominal isotropic resolution, as described in Materials and Methods and in Table 1. The read dimension corresponds to the red arrow direction, the 2nd low bandwidth (SPEN, EPI) dimension correspond to the blue arrow direction, while the phase-encoded slab encoding corresponds to the green arrow direction. Magenta arrows indicate some of the most evident distortions in the EPI images. The red markers in the b0 images indicate the positions of the orthogonal slices. See Supplementary Information for 3D video renderings of these data.

