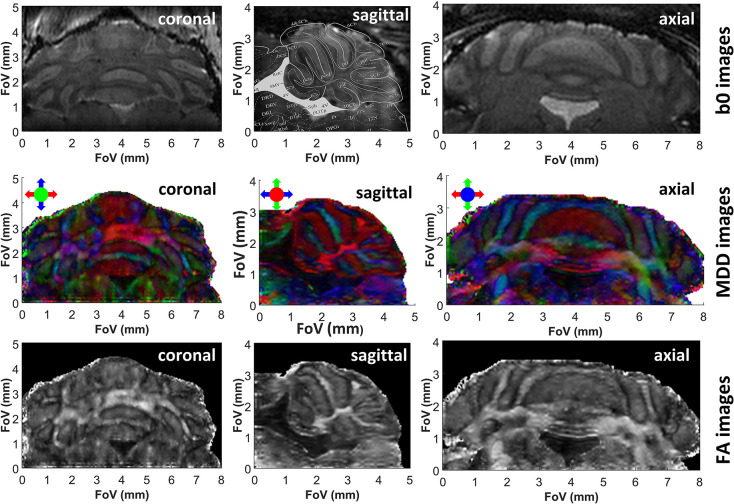
Figure 3.
b0, color-coded MDD and FA images extracted from 3D SPEN in vivo brain experiments zooming in the cerebellum, at a 75 μm nominal isotropic resolution. Each image is identified by the orientation of the shown slice. The read dimension corresponds to the red arrow direction, the 2nd phase and low bandwidth dimension correspond to the blue arrow direction and the slab with constant time phase encoding correspond to the green arrow direction. Superimposed on the sagittal b0 image are contours extracted from the Paxinos and Franklin mouse brain atlas (Franklin and Paxinos, 2008) at a lateral position of 0.24 mm, evidencing the close correspondence between the features revealed by the DTI in vivo measurements and those evidenced by ex vivo histology. See Supplementary Information for 3D renderings of these data.

