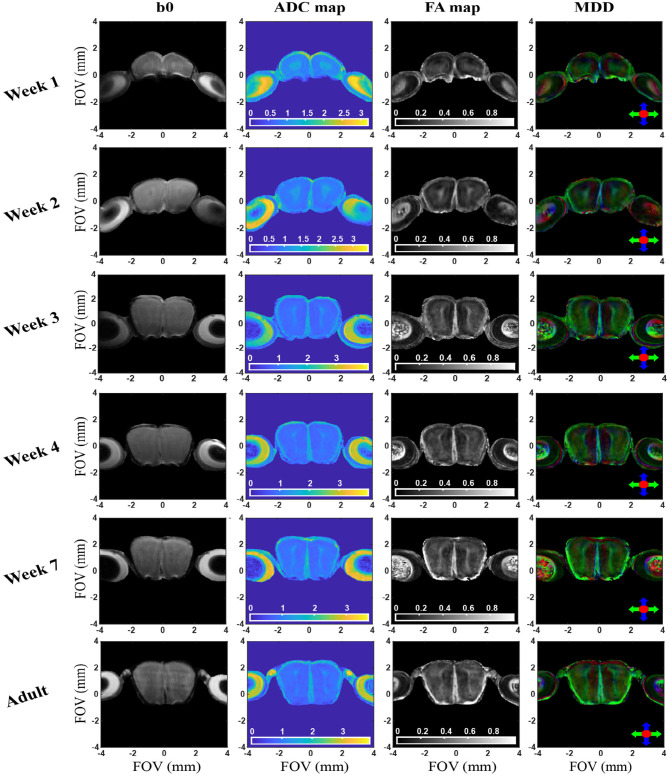
Figure 5.
b0, ADC, FA, and MDD images extracted from in vivo 2D SPEN brain experiments for a representative slice/animal, focusing on the OB region. Axes indicate dimensions in mm; ADCs are mapped in units of 10−3 mm/s2. See text for additional experimental details and Supplementary Information for additional slices / animals. The curvature observed in the bottom of the OB/eyes axis appearing to decrease with age, arises from field inhomogeneities.

