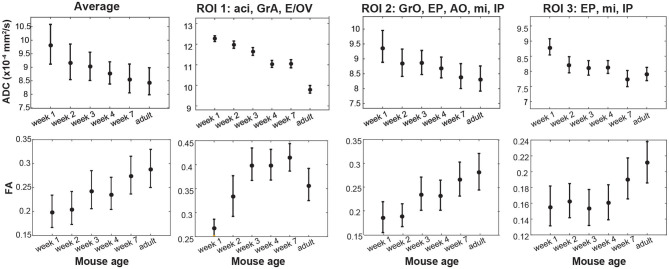
Figure 6.
Isotropic ADC and FA maturation for the OB and for labeled ROIs as illustrated in Supplementary Figure 6, observed for different animals as a function of age. Two different animals were scanned for each age; 12 different animals were thus scanned in the study. Bars represent the scattering measured for each observable within each OB/ROI for each age, rather than errors the measurements. See the main text for constituents and abbreviations used in these different ROIs.

