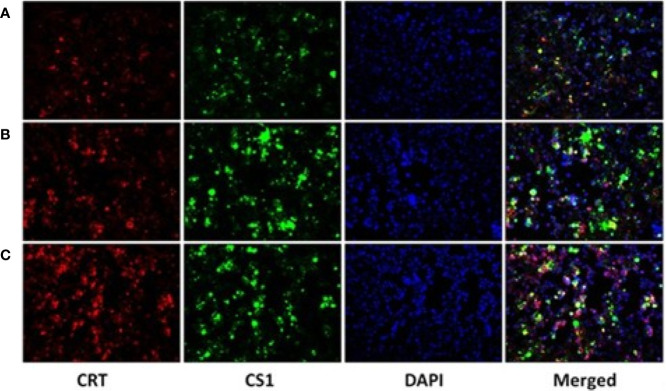
Figure 2.
CS1 and CRT protein expression observed by fluorescence microscopy (× 200). (A) Control, 293T cells transfected with PcDNA3.1; (B) the density of green fluorescence increased significantly in 293T cells transfected with PcDNA3.1-CS1, revealing high levels of CS1 protein expression in PcDNA3.1-CS1 transfected cells; (C) the density of both green and red fluorescence increased significantly in 293T cells transfected with PcDNA3.1-CS1/CRT, revealing high expression of both the CS1 and CRT proteins in PcDNA3.1-CS1/CRT-transfected cells.

