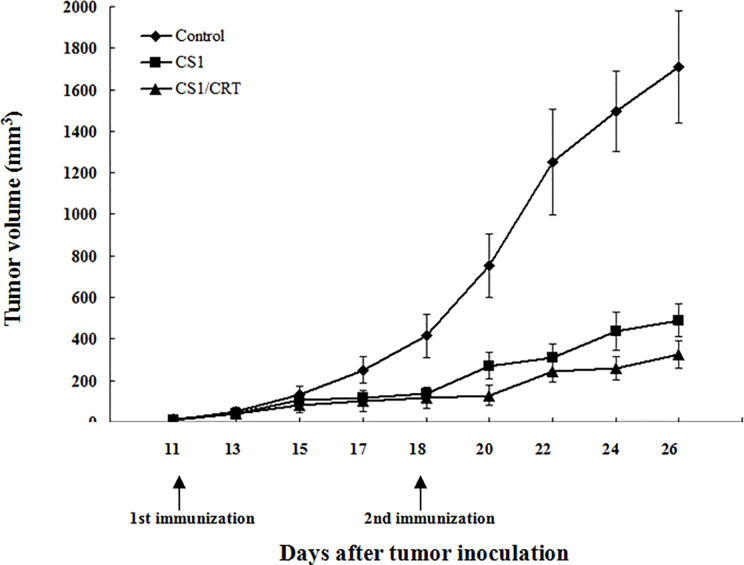
Figure 3.
Effect of the DNA vaccine on tumor growth: The mean volume of the tumor mass in the control group (immunized with pcDNA3.1, n=6) was much larger than that of the pcDNA3.1-CS1 (n=6) and pcDNA3.1-CS1/CRT group (n=6). The group mean tumor volumes were significantly different between the two experiment groups and the control group (mean ± SD. P < 0.01, respectively), and there was also significant difference between the CS1 and CS1/CRT group (mean ± SD. P < 0.05), when the booster injection was administrated on D18 (seven days after the first injection). DNA vaccines significantly suppressed the growth of myeloma cells and the inhibition of the CS1/CRT fusion DNA vaccine on the tumor cells was more obvious than that of the CS1 vaccine.

