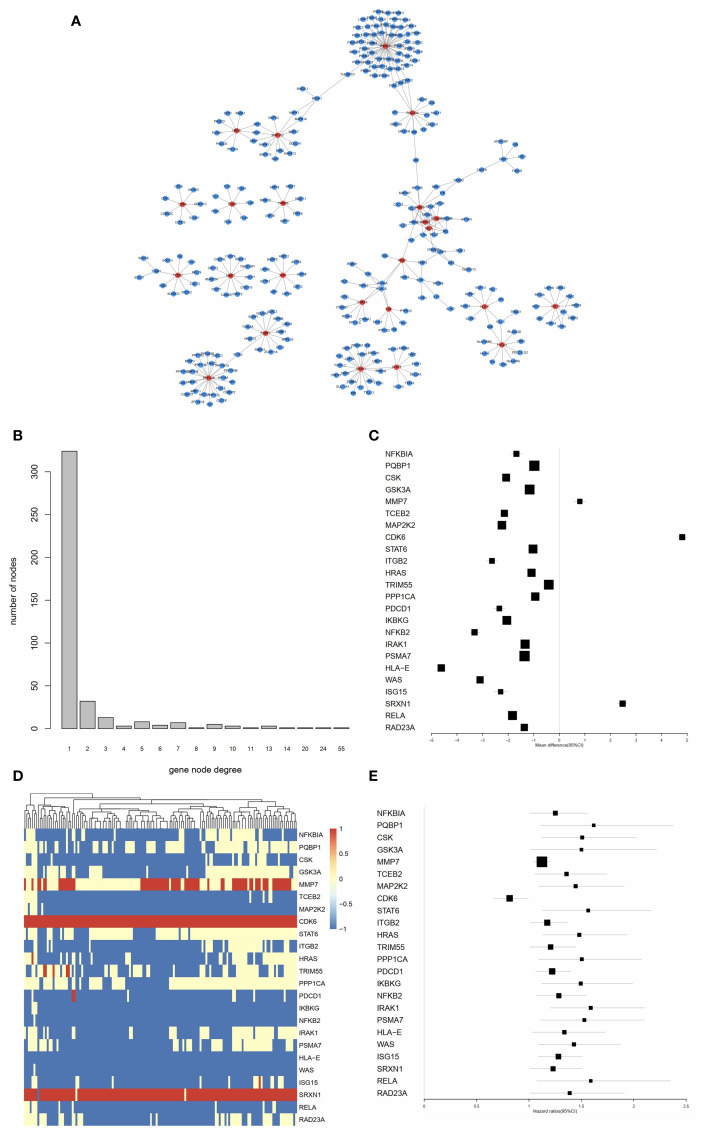
Figure 4.
Identification of hub IRGs and their molecular characteristics. (A) PPI network of the 24 hub IRGs. (B) The relationship between gene node degree and the number of nodes. (C) Mean expression differences of hub IRGs between AML and normal controls. (D) Cluster graph of 24 hub IRGs in the AML samples. The darker red color represents a higher level of gene expression, while the darker blue color represents a lower level of gene expression. (E) Hazard ratios (HR) show the prognostic value of the hub IRGs. A Gene with a HR of greater than 1 indicates a risk factor for prognosis, while a HR of less than 1 indicates a protective effect.

