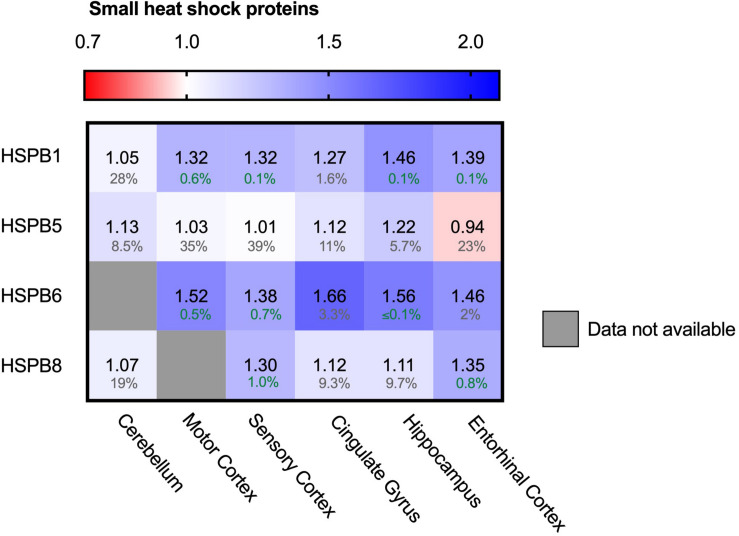
FIGURE 7.
Neuronally expressed sHSPs upregulated in AD brain. Heat map of sHSPs in different brain regions. Numbers represent the fold change in AD brains versus controls, indicated per brain region (blue gradient; white, no change; decrease, red gradient). Gray boxes represent unavailable data. FDR values are indicated as percentage. HSPB1 and HSPB6 are strongly increased in all brain regions, HSPB5 and HSPB8 show only minor differences accompanied by high FDRs.

