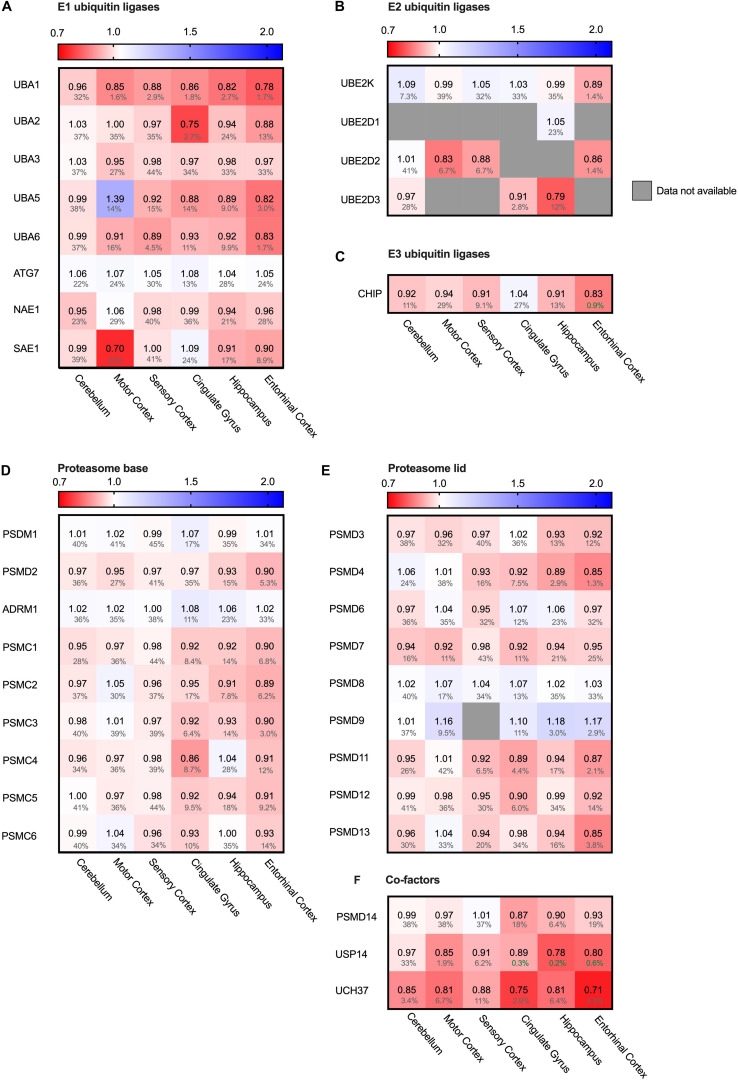
FIGURE 9.
Ubiquitin ligases largely unaffected in AD. Heat map of components of the ubiquitin ligases in different brain regions. Numbers represent the fold change in AD brains versus controls, indicated per brain region (blue gradient; white, no change; decrease, red gradient). Gray boxes represent unavailable data. FDR values are indicated as percentage. (A–C) E1, E2 and E3 ubiquitin ligases do not show any notable difference in protein levels in AD affected brain regions. (D–F) Components of the base and lid of the proteasome do not show any notable difference in protein levels in any of the brain regions. Some co-factors of the proteasome, such as Usp14 and Uch37, are slightly decreased in AD brain.

