
Figure 11.
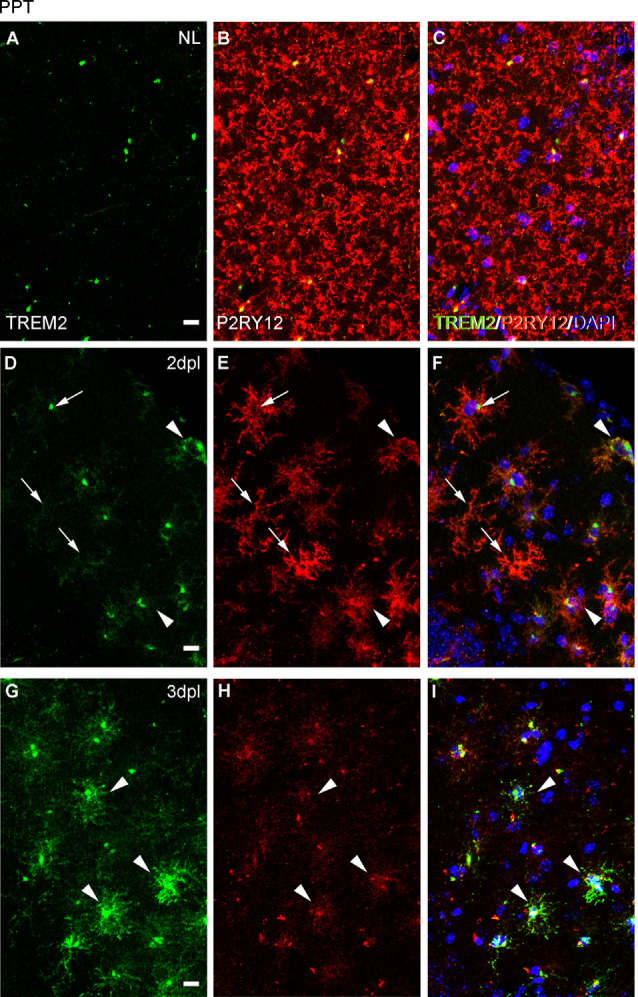
Analysis of P2RY12 expression in microglial cells after PPT. (A–I) Representative images showing P2RY12 expression in the DG of the hippocampus in NL conditions (A–C), at 2 dpl (D–F), and 3 dpl (G–I) after PPT. In NL conditions, TREM2 (in green) is expressed accumulated adjacent to the nucleus, and high levels of P2RY12 (in red) are found in all microglial cells. After lesion, at 2 dpl, most microglia show low levels of TREM2 in ramifications and high levels of P2RY12 expression in all microglial cells (arrows). Also, some microglia with high levels of TREM2 expression and low levels of P2RY12 microglia are observed (arrowheads), being the latter the microglial phenotype mostly seen at 3 dpl. Scale bar (A–I) = 10μm.