Figure 2.
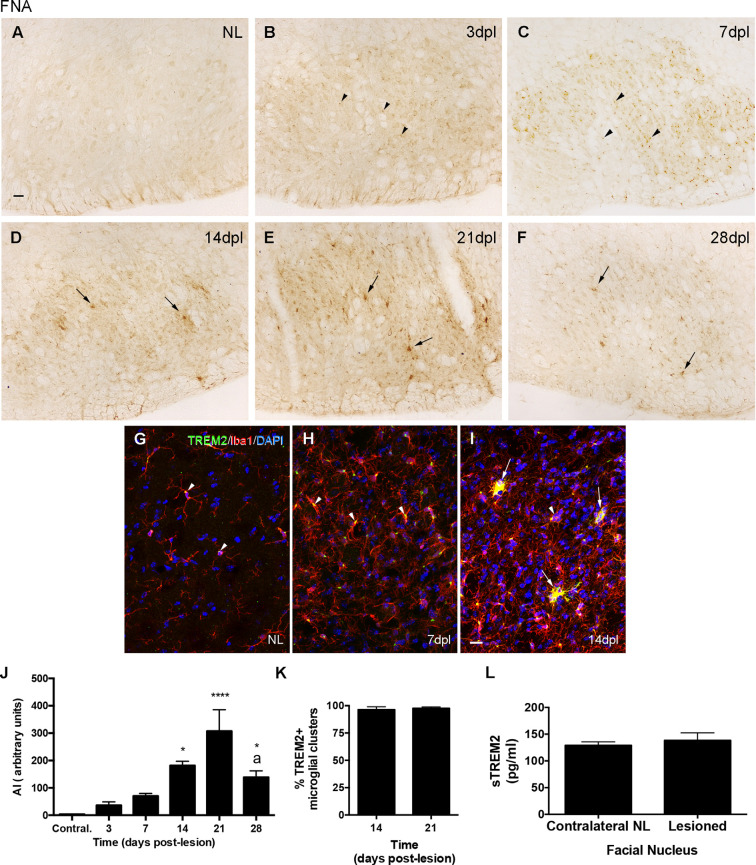
Temporal pattern of TREM2 changes in microglial cells after facial nerve axotomy (FNA). (A–F) Representative images showing TREM2 staining in the contralateral NL, as well as the ipsilateral sides of the FN from 3 to 28 dpl. From NL to 7 dpl TREM2 is mainly restricted to a perinuclear location (arrowheads), whereas from 14 dpl onwards TREM2 is extended to microglia ramifications and clusters (arrows). (G–I) Double immunohistochemistry showing microglial cells positive for TREM2 (green) and Iba1 (red). Note that in both the NL side and at 7 dpl, TREM2 is confined to areas around the nucleus of some Iba1+ cells (arrowheads), whereas at 14 dpl expression was detected in microglial prolongations in some microglial clusters (arrows). It is important to note that occasional Iba1 + TREM2-clusters were found at this time-point (arrowheads in I). (J) Graph showing the quantification of the AI index for TREM2 along the different time-points. Note the increase of TREM2 until 21 dpl and the later decrease (one-way ANOVA, time effect p < 0.0001; post hoc Tukey’s test *p < 0.05, ****p < 0.001 compared to NL; a p < 0.01 compared to the previous time-point). (K) Graph showing the percentage of microglial clusters containing TREM2+ microglial cells with expression in their ramifications at 14 and 21 dpl. (L) Graph showing the quantification of sTREM2 (pg/ml) in the FN of contralateral NL and the corresponding ipsilateral FN of mice lesioned at 21 dpl. No significant differences in the amount of sTREM2 are detected (paired Student’s t-test, p = 0.61). Scale bar (A–F) = 30 μm; (G–I) = 50 μm.

