
Figure 3.
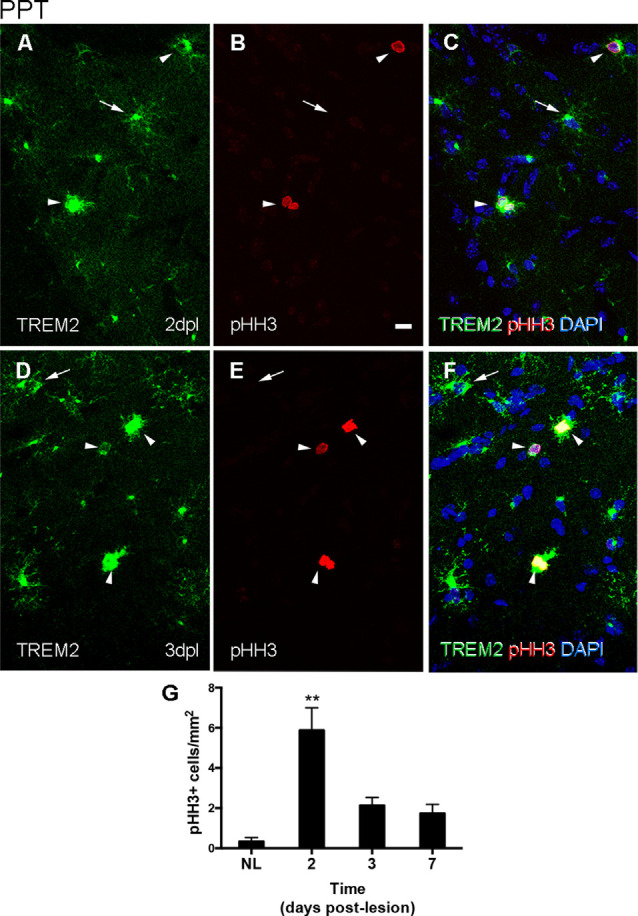
Determination of the proliferative activity of TREM2+ microglial cells after PPT. (A–F) Representative double-immunolabeled images combining TREM2 (green) and PHH3 (red) in the DG of PPT-lesioned animals at 2 dpl (A–C) and 3 dpl (D–F). Note that at both time points PHH3+ cells showed membranal TREM2 expression in the ramifications and soma of microglial cells (arrowheads). However, not all TREM2+ microglial cells with expression in their ramifications were undergoing mitosis (arrows). (G) Graph of PHH3+ cell density (cell/mm2) in NL and PPT lesioned animals after 2, 3, and 7 dpl (one-way ANOVA, time effect p < 0.0001; post hoc Tukey’s compared to NL **p < 0.01). Scale bar (A–F) = 10 μm.