
Figure 7.
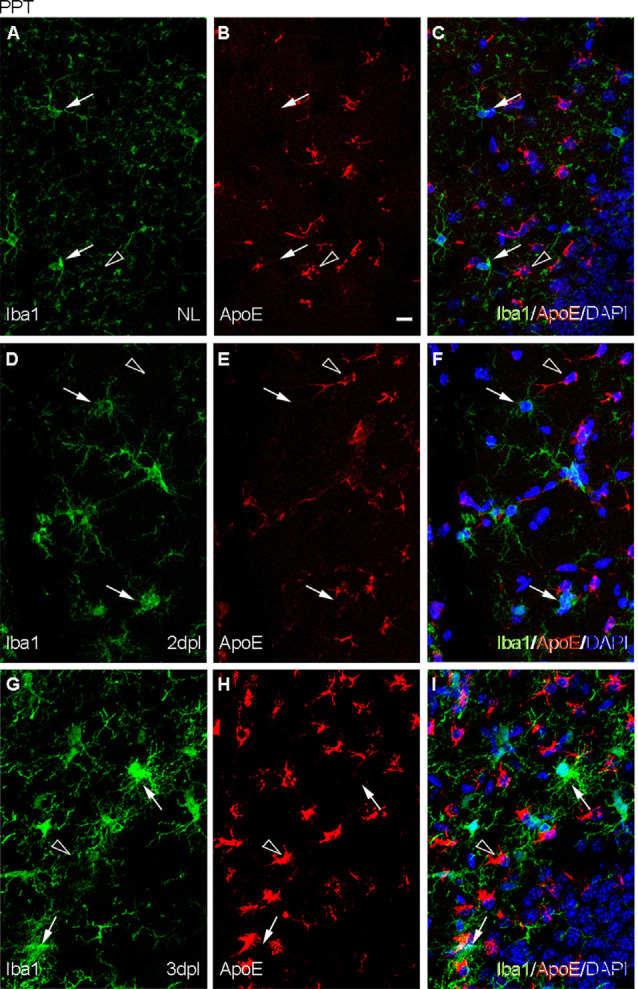
Analysis of the expression of TREM2 ligand ApoE after PPT. (A–I) Representative images of double immunofluorescence combining ApoE (red) and Iba1 (green) in the NL DG (A–C) and at 2 dpI (D–F) and 3 dpl (G–I) after PPT. Note that ApoE expression could be observed on astrocyte-like cells (empty arrowheads), but not in microglia (white arrows) in all the time-points. Scale bar (A–I) = 10 μm.