
Figure 8.
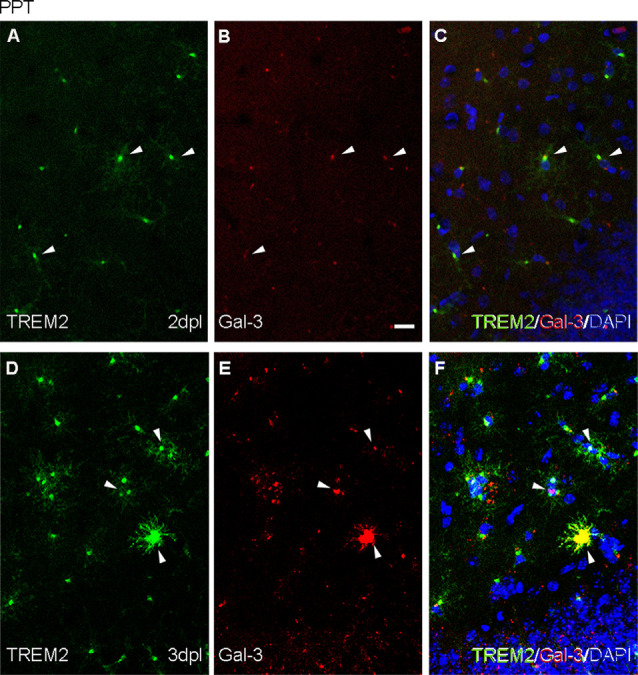
Analysis of the expression of TREM2 ligand Galectin-3 after PPT. (A–F) Representative double immunofluorescence images combining Galectin-3 (red) and TREM2 (green) at 2 dpI (A–C) and 3 dpI (D–F) after PPT. Occasional microglial cells showing TREM2 expression in their ramifications contained Galectin-3 (white arrowheads) as perinuclear staining in both time-points. Note that at 3 dpI some microglial cells also presented Galectin-3 in their ramifications, indicating an increase of Galectin-3 compared to 2 dpI. Scale bar (A–F) = 10 μm.