
Figure 11.
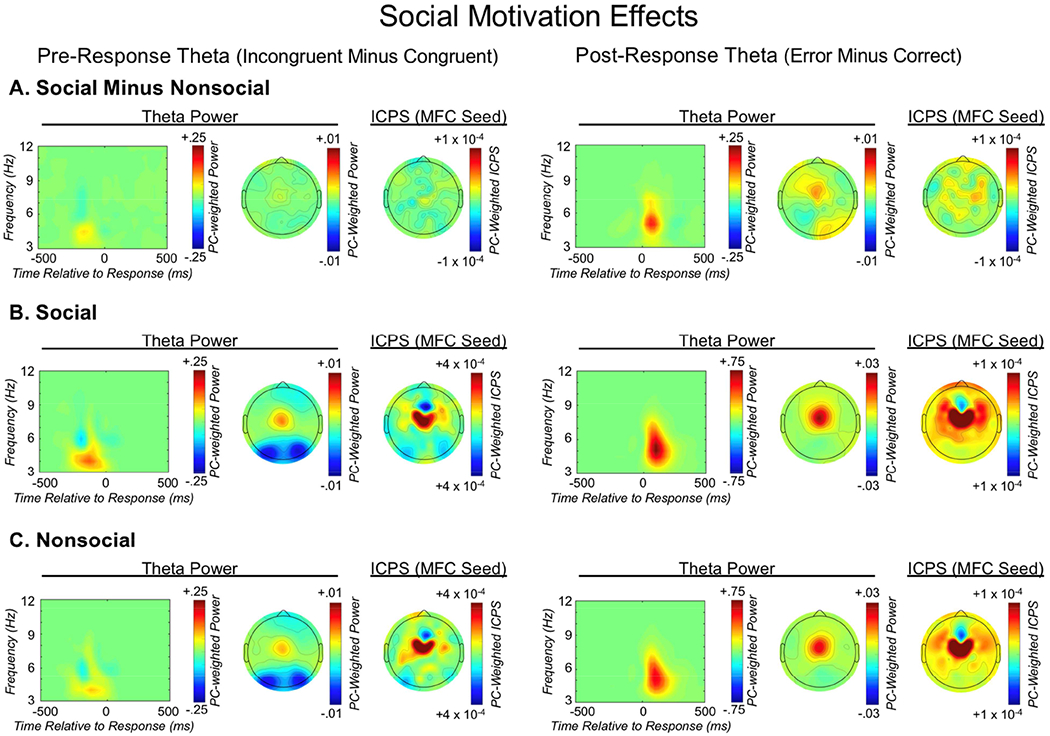
The effects of social observation on pre- and post-response theta dynamics. From left to right, each row depicts: the medial-frontal cortex (MFC) total power time-frequency distribution weighted by the pre-response theta factor; the corresponding topographic plot; MFC-seeded inter-channel phase synchrony (ICPS) within the pre-response theta factor; the MFC total power time-frequency distribution weighted by the post-response theta factor; the corresponding topographic plot; MFC-seeded ICPS within the post-response theta factor. From top to bottom, each row depicts: A) the difference between social and nonsocial congruency-related and error-related difference scores of neural activity; B) social congruency-related and error-related difference scores of neural activity; C) nonsocial congruency-related and error-related difference scores of neural activity.