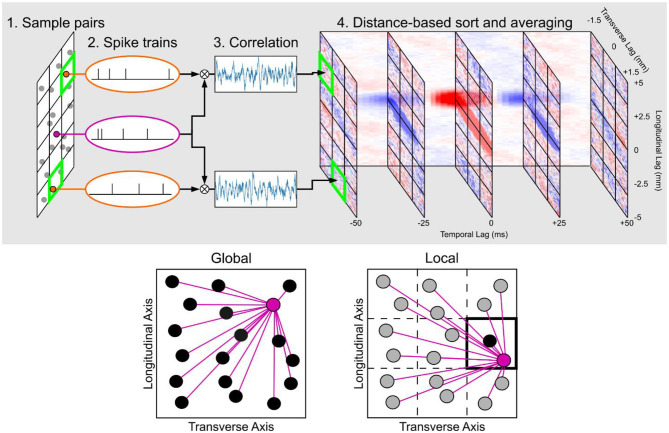
Figure 4.
Summary of the construction of the space-time correlation maps. (Top row) The workflow in calculating pairwise spike correlations and placing them in a matrix that is organized by the longitudinal, transverse, and temporal lags. (Bottom row) Global vs. local space-time correlation map. In the global map, all neuron pairs were considered to construct an average correlation map to represent all neurons that were included to compute the map. In the local map, only neuron pairs with at least one neuron within the chosen section were used in the calculation which results in a correlation map that is specific to the section to which the neuron pairs were constrained. In the local map example highlighted in the figure, the resulting correlation map would be representative for the neurons within the section located in the second row and third column.

