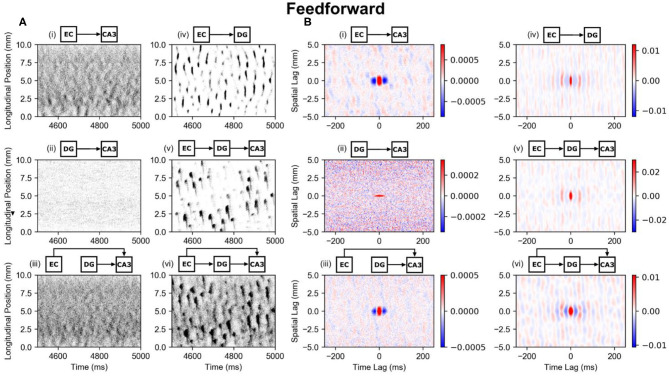
Figure 5.
Raster plots and global correlation maps for the effects of the perforant path and mossy fibers on CA3 pyramidal cells. (A) Spiking activities of the CA3 pyramidal cells are indicated with black dots and are organized based on their longitudinal position and time of spike. The circuits above each subplot indicate which circuit configuration was used. All plots indicate CA3 pyramidal cell activity except for the EC-DG plot which shows dentate granule cell activity. (B) The corresponding space-time correlation maps are shown. The longitudinal-temporal cross-sections are shown at a transverse lag of 0 mm. Red areas represent positive correlation, and blue areas represent negative correlation. (A,B) (i) PP-CA3 model: CA3 response to random perforant path activity. (ii) rMF-CA3 model: CA3 response to random dentate granule cell activity. (iii) PP-rMF-CA3 model: CA3 response to both random perforant path and random dentate granule cell activity. (iv) PP-DG model: DG response to random perforant path activity. (v) wcMF-CA3 model: CA3 response to solely correlated dentate granule cell activity, i.e., CA3 response to disynaptic perforant activity via dentate granule cells. (vi) PP-wcMF-CA3 model: CA3 response due to random perforant path and correlated dentate granule cell activity.

