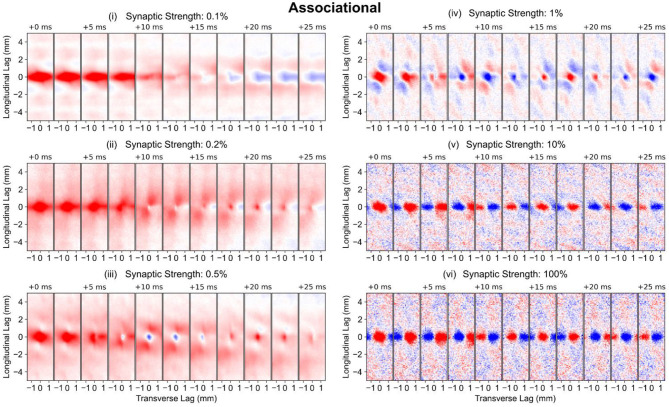
Figure 8.
Longitudinal-transverse cross-sections of global correlation maps at different temporal lags for simulations using the PP-wcMF-A-CA3 model, which includes the perforant path, mossy fiber, and associational projections to CA3. In the subplots, the strength of the associational synapses was modulated as indicated by the subplot titles. All other synapses remained at their experimentally constrained strength. The evolution of spatial correlation across positive time lags are shown. Red areas represent positive correlation, and blue areas represent negative correlation.

