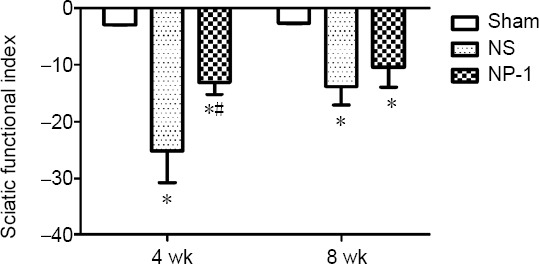
Figure 2.

Sciatic functional index among the three groups.
Each group contained six rats. The SFI of the NP-1 group was much lower than that of the NS group. One-way analysis of variance was used to check the differences among groups. *P < 0.05, vs. sham group; #P < 0.05, vs. NS group. Data are expressed as the mean ± SD (n = 6; one-way analysis of variance followed by least significant difference post hoc test). NP-1: Neutrophil peptide 1; NS: normal saline; SFI: sciatic functional index.
