
Figure 3.
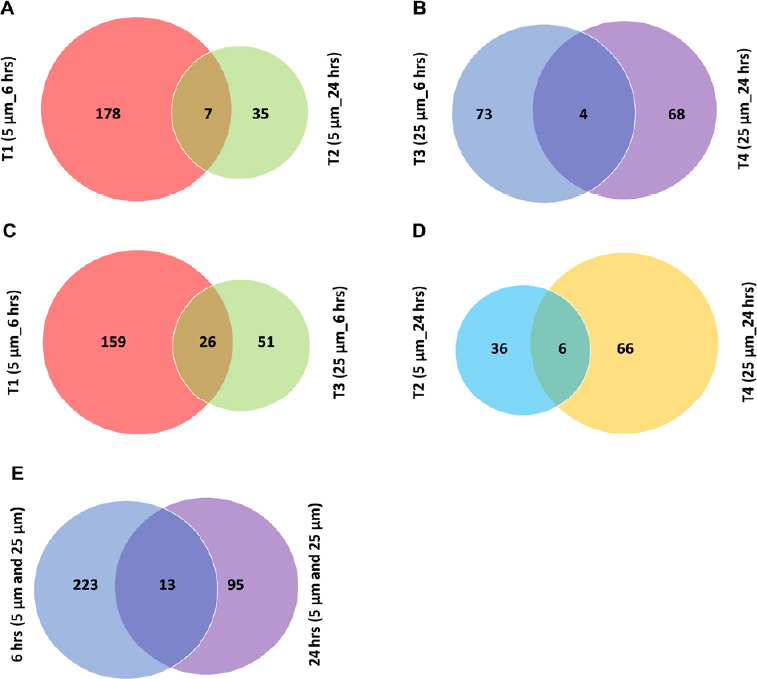
Venn diagram analysis of regulated proteins identified under different conditions.
(A) Venn diagram indicating the overlap between the differentially expressed proteins identified and quantified in T1 and T2 with 5 µM of β-amyloid peptide (Aβ) at 6 and 24 hours, respectively (1% false discovery rate (FDR). (B) Venn diagram indicating the overlap between the differentially expressed proteins identified and quantified in T3 and T4 with 25 µM of Aβ at 6 and 24 hours, respectively (1% FDR). (C) Venn diagram indicating the overlap between the differentially expressed proteins identified and quantified in T1 and T3 at 6 hours with 5 µM and 25 µM of Aβ, respectively (1% FDR). (D) Venn diagram indicating the overlap between the differentially expressed proteins identified and quantified in T2 and T4 at 24 hours with 5 and 25 µM of Aβ, respectively (1% FDR). (E) Venn diagram indicating the overlap between the differentially expressed proteins identified and quantified at 6 hours with two concentrations (T1 and T3) and at 24 hours with two concentrations (T2 and T4), respectively (1% FDR).