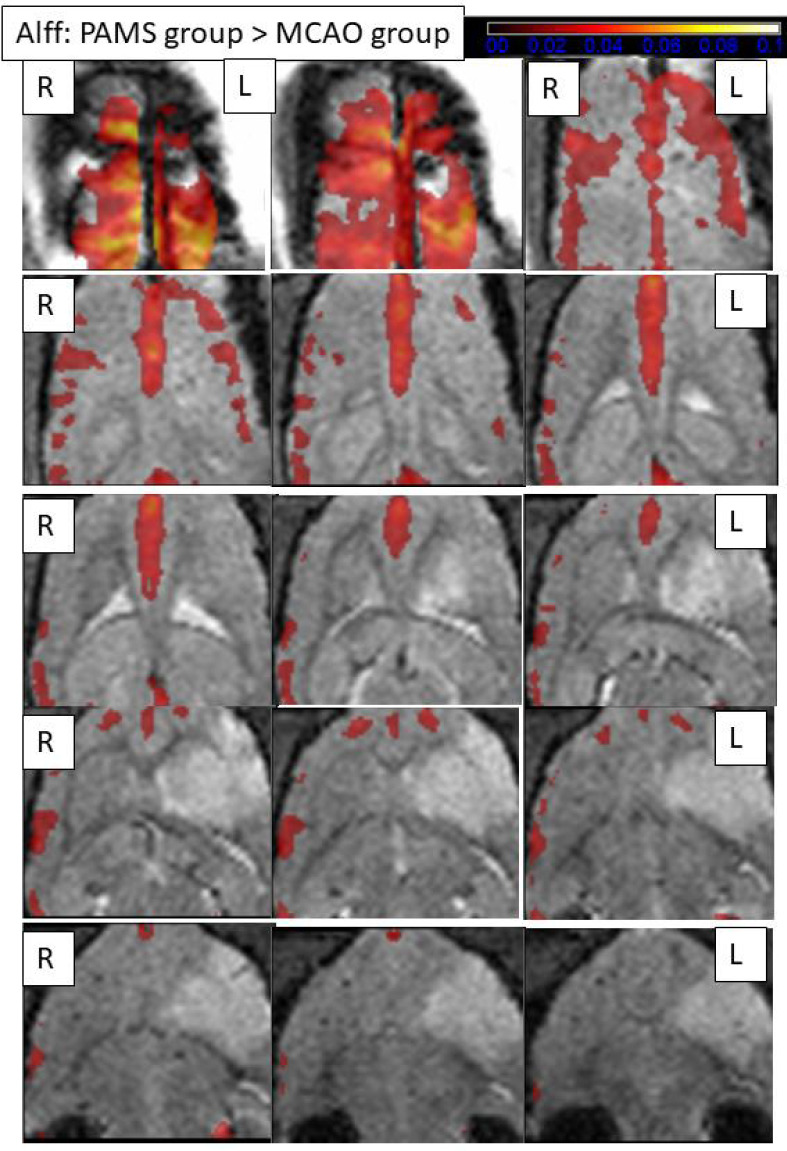
Figure 5.

Comparisons of the amplitude of low-frequency fluctuations (ALFF) between the two groups 20 days after MCAO (fMRI).
Resting-state fMRI of ALFF 20 days after MCAO. ALFF maps showing the PAMS group subtracted from the MCAO group (cluster size > 10 voxels; two samples t-test, P < 0.005). A larger ALFF signal difference is detected in the cortex around the ischemic periphery in the bilateral cortex compared with the MCAO group. The color bars indicate the t-value of the group analysis (the brighter the color, the higher the value) (fMRI). L: Ipsilateral cortex; R: contralateral cortex.
