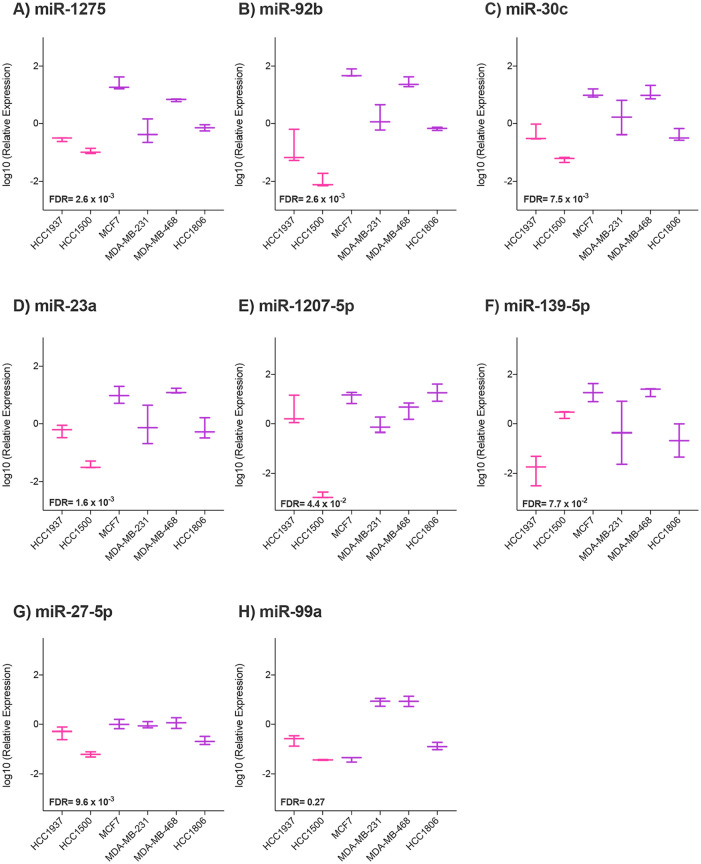
Figure 3.
RT-qPCR miRNA expression validation results for breast cancer cell lines. Boxplots represent the sample distribution with the mean for each breast cancer cell line from old and young women. Expression was quantified using the RT-qPCR and calculated by ΔΔCt method. Y axis represents logarithmic transformation of the relative expression. Differences by miRNA between breast cancer cell lines from young (represented in pink color) and older (represented in purple) women were analyzed by Wilcoxon rank sum test: (A) miR-1275, (B) miR-92b, (C) miR-30c, (D) miR-23a, (E) miR-1207-5p, (F) miR-139-5p, (G) miR-27a- 5p, and (H) miR-99a.

