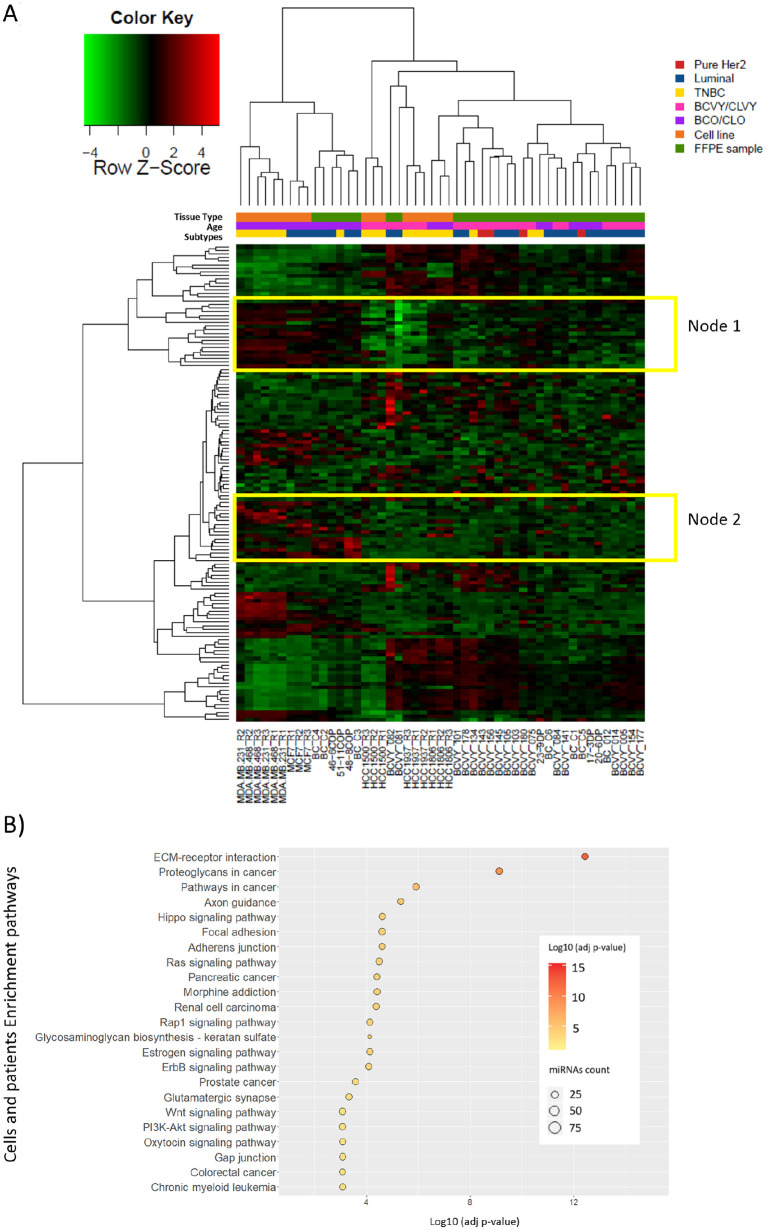
Figure 4.
Hierarchical clustering centered on the median representation and enrichment pathway analysis of the expression of significantly deregulated miRNAs between young and old samples (patients and cell lines). (A) Heatmap representing the expression of 132 miRNAs that were significantly deregulated between young and old samples from BC patient tissue and cell lines. Expression is shown in different intensities, green below the median, red above and black unchanged with respect to the median. Young samples are represented in pink and older are indicated in purple. Molecular subtypes are indicated as Pure Her2 (red), triple negative (yellow) and luminal (blue). Sample precedence is indicated as orange for breast cancer cell lines and green for FFPE patient tissue samples. (B) Pathways significantly deregulated by the 132 miRNA differently expressed in the combined study with breast cancer cell lines and FFPE samples. Enrichment study was performed by DIANA-mirPath and pathways obtained presented a FDR-adjusted P-value < .001. Dot color indicates a logarithmic transformation of FDR-adjusted P-values (orange for most significant pathways and yellow for lower P-values) and miRNA count indicates the number of miRNAs involved in the represented pathways.
TNBC: triple negative breast cancer; Lum: luminal; BCO: breast cancer tumors from women older than 35 years old; BCVY: breast cancer tumors from women younger than 35 years old; CLO: BC cell lines from older patients; CLVY: BC cell lines from very young patients; FFPE: Formalin-fixed, paraffin-embedded.

