Figure 5.

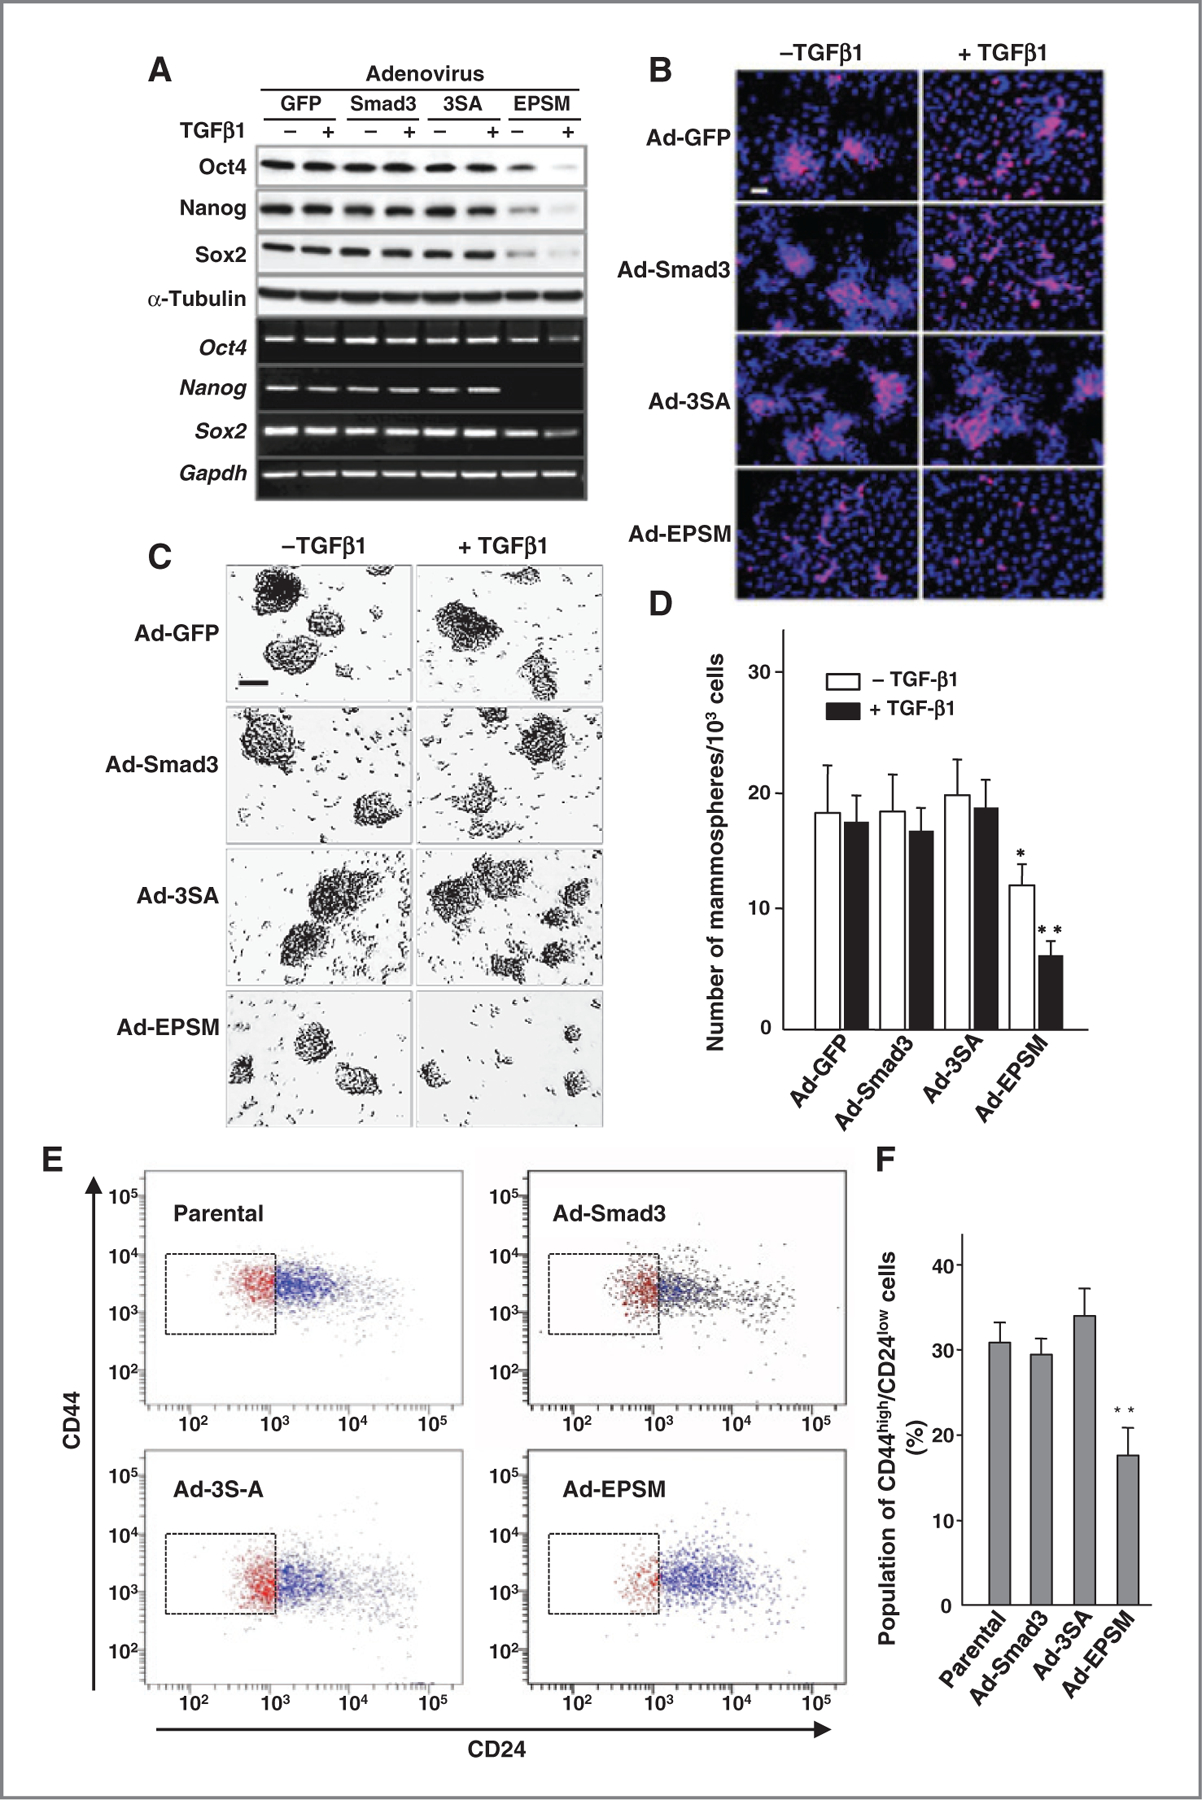
Mutation of the Smad3 linker phosphorylation sites reduces putative cancer stem cell subpopulation. A, immunoblot analysis (top) and RT-PCR (bottom) for Oct4, Nanog, and Sox-2 in the adenovirus-infected CA1a cells with or without TGFβ1. B, immunofluorescence staining of Oct4 (red) counterstained with DAPI (blue). Scale bar, 50 µm. C, representative photos of mammospheres formed from the adenovirus-infected CA1a cells treated with or without TGFβ1. Scale bar, 50 µm. D, the number of mammospheres per 1,000 seeded cells. The mean ± SD from four experiments. *, 0.01 < P < 0.05; **, P < 0.01, compared with Ad-Smad3–infected cells without TGFβ1. E, FACS analysis of cell-surface markers of CD44 and CD24 in CA1a cells infected with Ad-Smad3, Ad-3SA, or Ad-EPSM. Parental cells were used as controls. F, the putative stem cell subpopulation with CD44high/CD24low (%). Each bar represents the mean ± SD from four samples per group. **, P < 0.01, compared with Ad-Smad3–infected cells. Each of the experiments was conducted three to five times with similar results.
