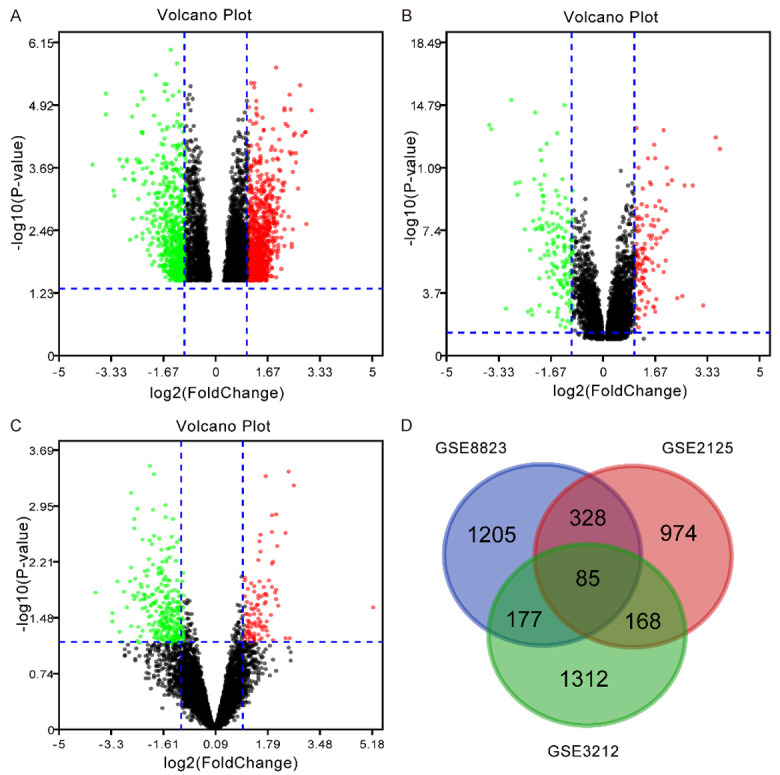
Figure 1.

Identification of differentially expressed genes in human alveolar macrophages between smokers and non-smokers. A-C: GEO2R was used to analyze the expression of DEGs in three data sets (GSE8823, GSE2125, and GSE3212 respectively, which are presented as a volcano plots. The red and green dots represent up and down, respectively. D: Venn diagram shows that there are 85 DEGs in the three databases.
