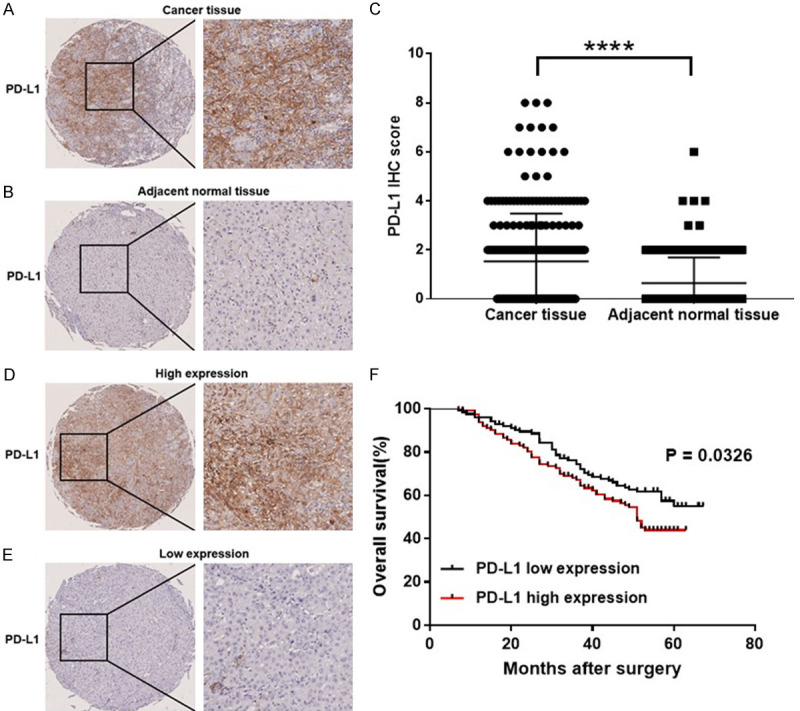
Figure 2.

Expression of PD-L1 in HCC. PD-L1 IHC staining of (A) cancer tissues and corresponding (B) adjacent normal tissues (Scale bar, 100 μm). (C) H-score of PD-L1 expression of cancer tissues and adjacent normal tissues. (D) High PD-L1 expression in human HCC tissues (Scale bar, 100 μm). (E) Low PD-L1 expression in human HCC tissues (Scale bar, 100 μm). (F) Survival curves of HCC patients with PD-L1 high expression and PD-L1 low expression. Significance was evaluated using the Log-rank test (P = 0.0326). Tumor tissues with H-scores greater than the median of all scored tumor tissues were classified as high PD-L1 expression. ****P < 0.0001.
