
Figure 3.
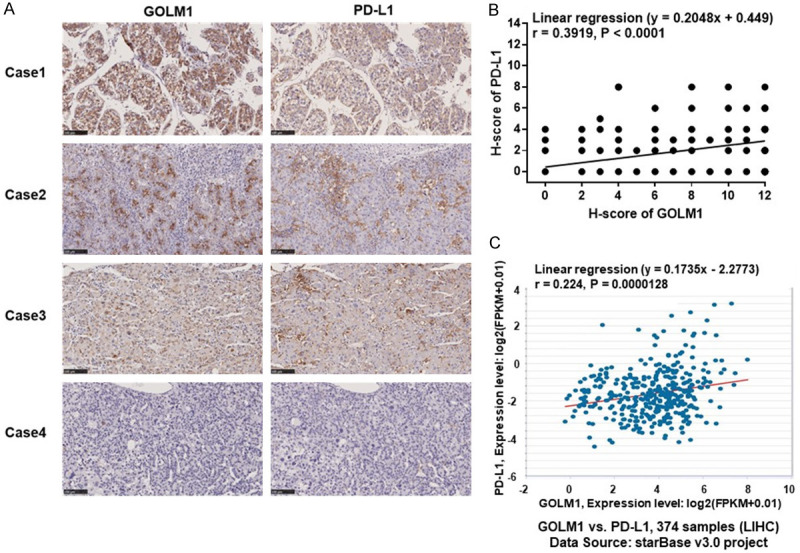
Correlation of GOLM1 and PD-L1. (A) Patient tissue samples were stained for GOLM1 and PD-L1. Representative pictures of IHC staining of HCC tumors for GOLM1 and PD-L1. (B) Correlation analysis of GOLM1 and PD-L1 expression in human HCC tissue microarray (n = 239, Linear regression (y = 0.2048x+0.449), r = 0.3919, P < 0.0001). (C) Correlation of GOLM1 and PD-L1 gene expression in the ENCORI database (C) from the ENCORI database.