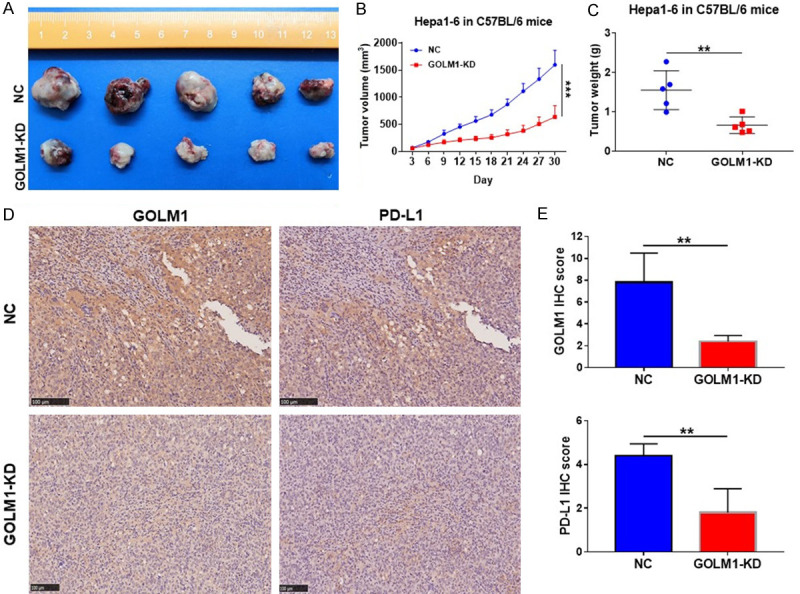
Figure 6.

GOLM1 knockdown inhibits tumor growth and downregulates the expression of PD-L1 in Hepa1-6 cells in vivo. A. Images of Hepa1-6 subcutaneous HCC tumors from each group (n = 5). B. Tumor growth curves in C57BL/6 mice from the Hepa1-6-NC and -GOLM1-KD groups. C. Tumor weight from the Hepa1-6-NC and -GOLM1-KD groups. D. Representative IHC images of GOLM1 and PD-L1 expression in Hepa1-6 subcutaneous HCC tumors. Scale bar = 100 μm. E. Graphic representation of IHC score of GOLM1 and PD-L1 expression in Hepa1-6 subcutaneous HCC tumors from NC and GOLM1-KD groups. **P < 0.01, ***P < 0.001.
