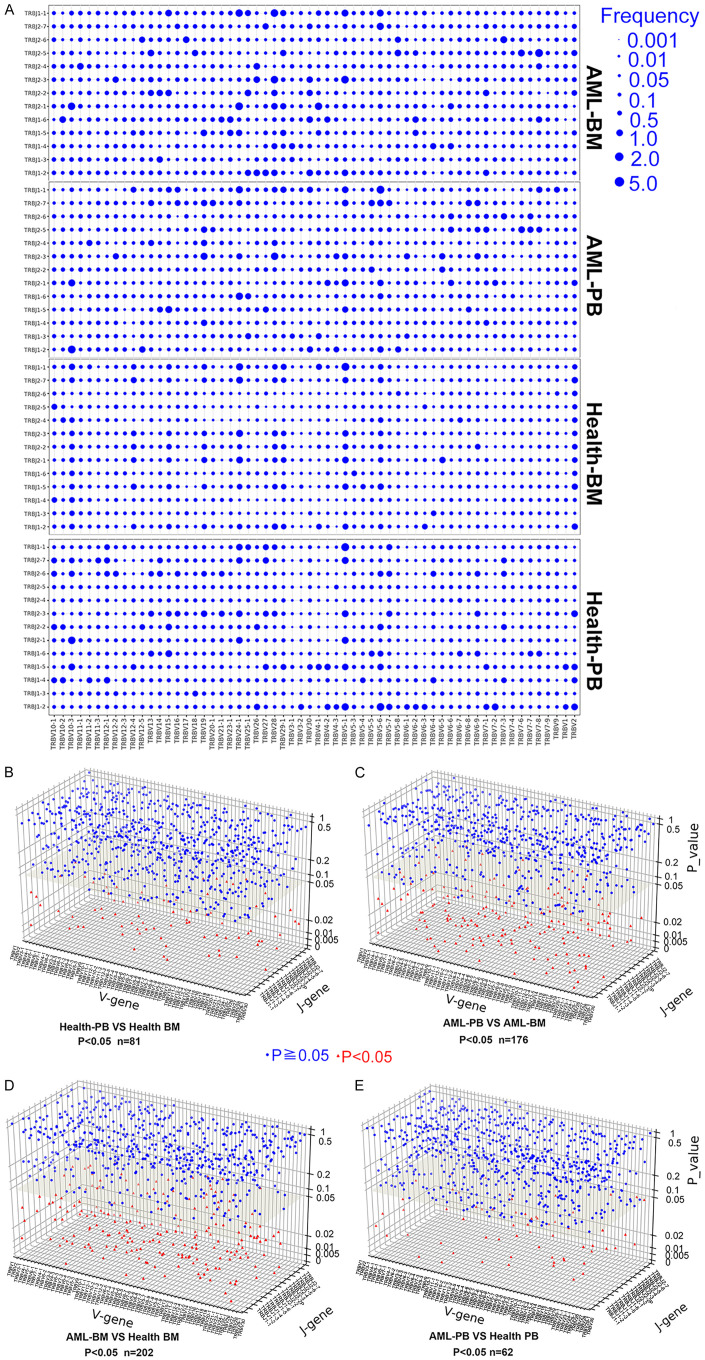
Figure 3.
Usage patterns of TCRβ V-J rearrangements in PB and BM CD8+ T cells from AML patients and healthy donors. (A) Dot plots depicting the mean frequency distribution of TCRβ V-J gene rearrangements for CD8+ T cells from the four groups. The variations in TCRβ V-J rearrangements for normal PB vs. healthy BM (B), AML PB vs. AML BM (C), AML BM vs. healthy BM (D), and AML PB vs. healthy PB (E) were investigated. The Mann-Whitney U-test was used to determine whether there were differences between the two groups. Blue circle, P < 0.05; red triangle, P ≥ 0.05.

