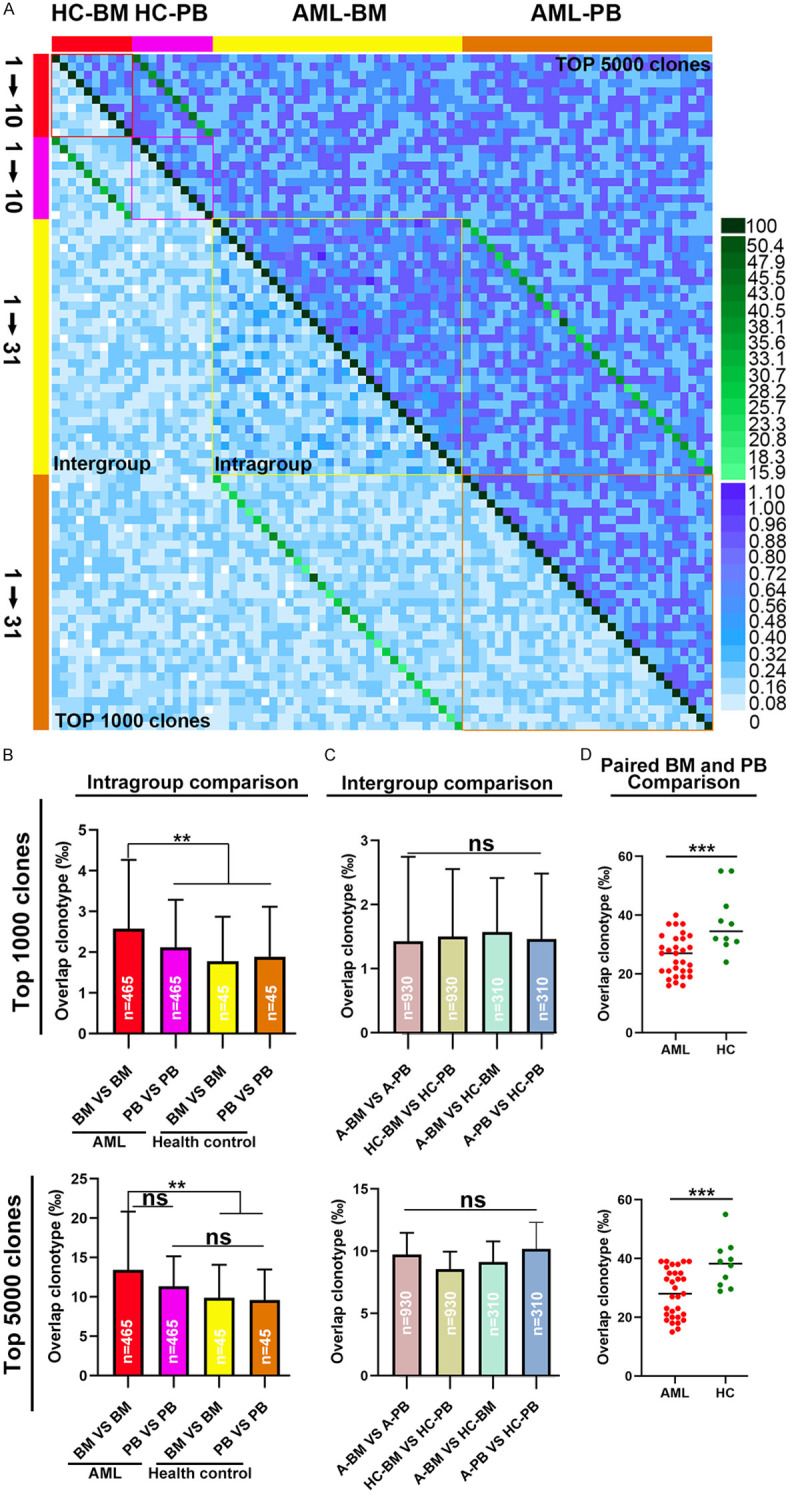
Figure 4.

Metrics for TCR β repertoire overlap in PB and BM CD8+ T cells from AML patients and healthy donors. (A) heat map was plotted to assess the similarity of the top 1000 most abundant CDR3 amino acid sequences or the top 5000 most abundant CDR3 amino acid sequences between any two samples. (B) Based on the top 1000 or top 5000 most abundant CDR3 amino acid sequences, repertoire overlap analysis was performed within each group of samples and (C) between groups of samples. (D) Based on the top 1000 or top 5000 most abundant CDR3 amino acid sequences, overlaps between BM and PB from the same individual in AML patients and healthy donors were determined. A dot is used to represent a patient sample. The Mann-Whitney U-test was used to determine whether there were differences between the two groups. Analysis of covariance was initially used for the multiple group comparison. Correction for multiple tests was performed using the false discovery rate method. ns indicates not significant; **P < 0.05; ***P < 0.01.
