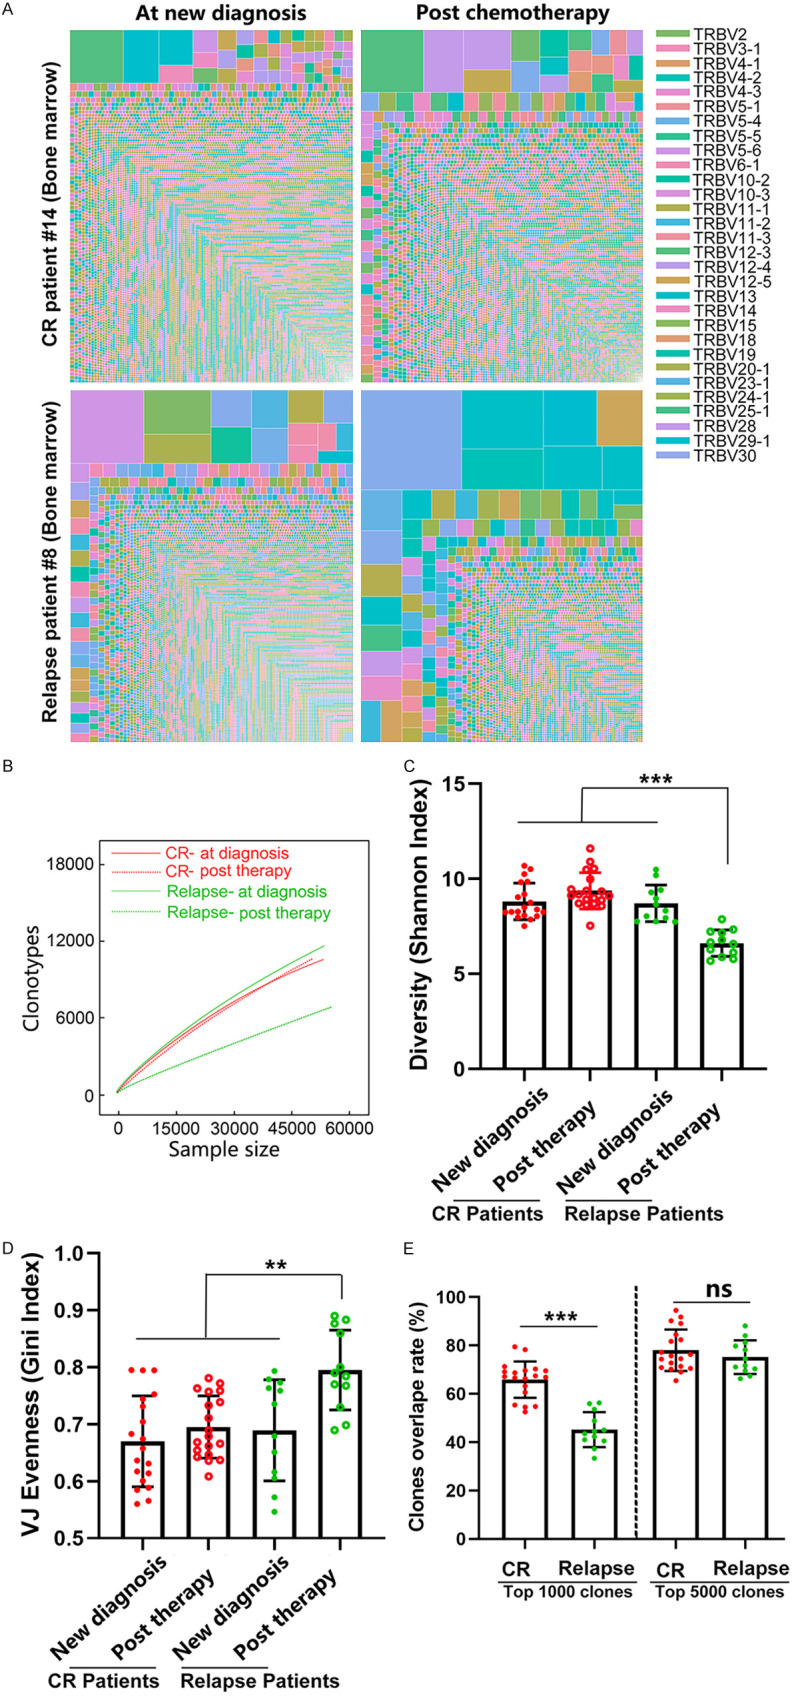
Figure 5.

A high degree of clonal expansion in BM CD8+ T cells from relapsed AML patients. (A) Treemap showing the clone repertoires in one patient who relapsed and one patient who remained in remission at new diagnosis and after chemotherapy. Each amino acid sequence was perceived as a separate clonotype, which was represented by a square, and the frequency was indicated by its area; different V genes are represented by different colors. (B) Rarefaction analysis of repertoires from one patient who relapsed and one patient who remained in remission at new diagnosis and after chemotherapy. The number of unique clonotypes in a subsample is plotted against its size (number of TCR cDNA molecules). The diversities of the T cell receptor repertoire in 12 patients who relapsed and 19 patients who had CR after chemotherapy were characterized by computing the Shannon index (C) and the Gini index (D). A dot is used to represent a patient sample. (E) Repertoire overlaps were determined at new diagnosis and after chemotherapy in BM from the same individual based on the top 1000 or top 5000 clonotypes. CR patients: patients who were newly diagnosed with AML and remained in complete remission after chemotherapy. Relapsed patients: patients who were newly diagnosed with AML and relapsed after chemotherapy. The Mann-Whitney U-test was used to determine whether there were differences between the two groups. Analysis of covariance was initially used for the multiple group comparison. Correction for multiple tests was performed using the false discovery rate method. ns indicates not significant; **P < 0.05; ***P < 0.01.
