Figure 6.

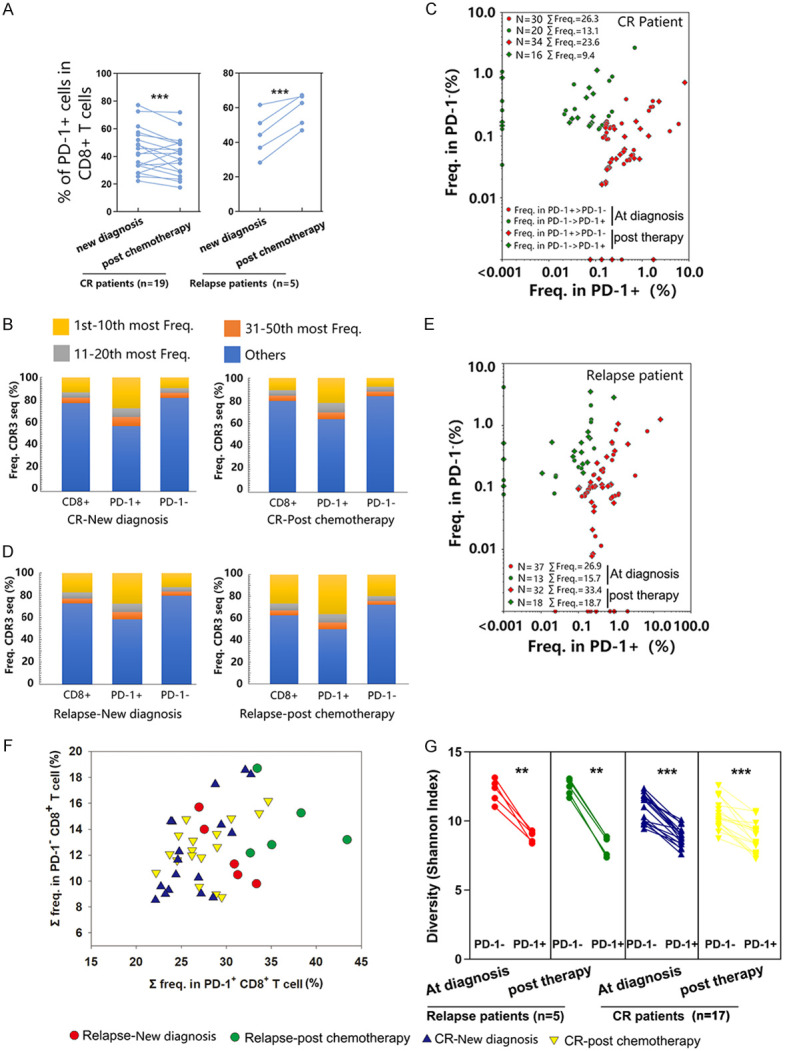
TCR repertoire distribution of CD8+ T cells based on PD-1 expression in CR and relapsed AML patients. (A) Expression of PD-1 was determined by flow cytometry. Samples from 5 patients who relapsed and 19 patients who had CR after chemotherapy were collected for flow cytometry analysis. (B-F) The clonotype distribution of CD8+ T cells was associated with PD-1 expression. CD8+ T cells were sorted from one patient who had CR (B and C) and one relapsed patient (D and E) based on the expression of PD-1. mRNA extraction and deep sequencing of TCRβ CDR3 were performed. (B and D) Analysis of TCRβ repertoire clonal frequency in CD8+ (as shown above), CD8+ PD-1+ (4 × 10⁴ cells), and CD8+ PD-1- (4 × 10⁴ cells) T cells. The abundances of the top 1 to 10, 11 to 20, and 21 to 50 clonotypes, as well as the remaining clonotypes, are shown. (C and E) The distribution of the top 50 most frequent clonotypes among CD8+ T cells was compared between the CD8+ PD-1+ populations and CD8+ PD-1- populations. Each dot represents a clonotype from a newly diagnosed sample; each rhombus represents a clonotype from a sample post chemotherapy. Red represents the frequency of clonotypes in CD8+ PD-1+ > CD8+ PD-1-; green represents the frequency of clonotypes in CD8+ PD-1- > CD8+ PD-1+. The total frequency (Σ freq.) of the clonotypes in each population is cumulative. (F) The top 50 clonotypes in CD8+ T cells were frequently distributed in the CD8+ PD-1+ and CD8+ PD-1- populations. Red dots represent samples collected at new diagnosis from patients who relapsed post chemotherapy; green dots represent samples collected after treatment from patients who relapsed post chemotherapy; blue triangles represent samples collected at new diagnosis from patients with sustained CR post chemotherapy; yellow triangles represent samples collected after treatment from patients with sustained CR post chemotherapy; CD8+ PD-1- and CD8+ PD-1+ T cell from 5 patients who relapsed and 17 patients who had CR after chemotherapy were collected for TCRβ CDR3 sequencing. (G) Shannon index comparison between CD8+ PD-1+ and CD8+ PD-1- populations. The Wilcoxon signed-rank test was used for matched paired comparisons. **P < 0.05; ***P < 0.01.
