Figure 1.

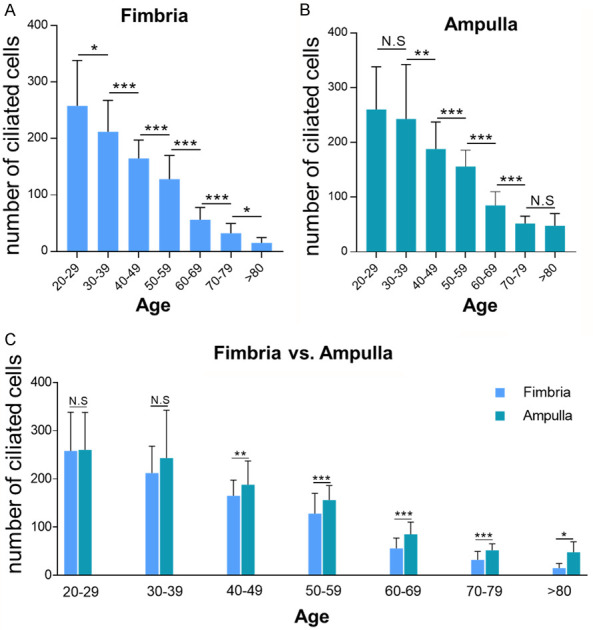
Ciliated cells distribution trend among different age groups, calculated by microscopic direct counting (H&E). A clear trend of reduction of the number of tubal ciliated cells was present in the aging process. A significant reduction started at age 30s in both fimbria and ampulla segments. Compared with ampulla region, further reduction of the tubal ciliated cells was detected in the fimbria. A. The number of ciliated cells in tubal fimbria region; B. The number of ciliated cells in tubal ampulla region; C. Comparisons of ciliated cells distribution between ampulla and fimbria. Statistically significant differences were determined using the Mann-Whitney U test. N.S, no significance; *P < 0.05; **P < 0.01; ***P < 0.001.
