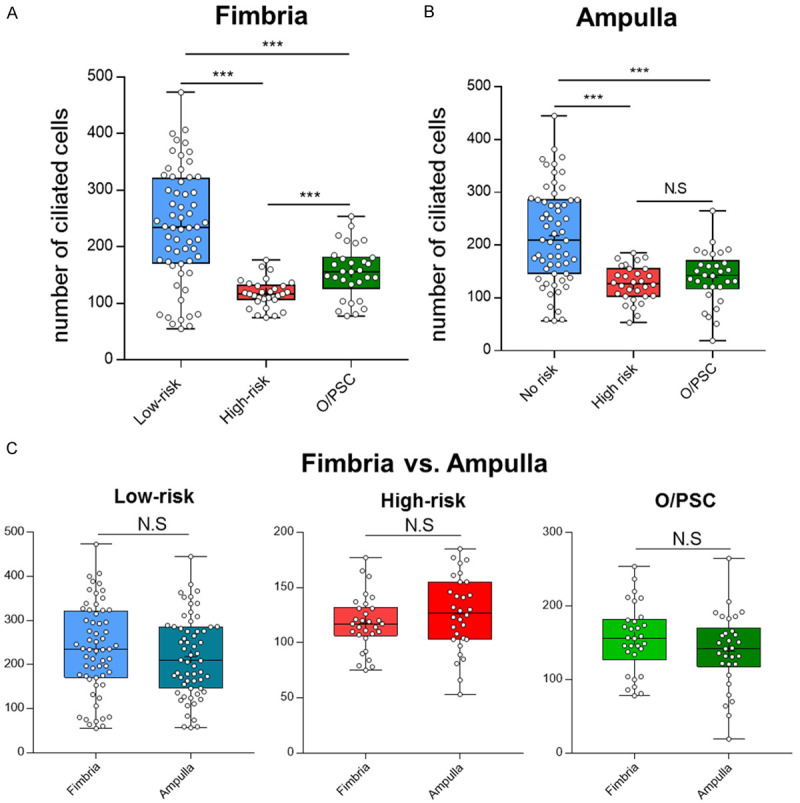
Figure 2.

Comparisons of the number of ciliated cells calculated by tubulin staining method among control (low-risk) and study groups (high-risk or O/PSC). Compared with the control group, the number of tubal ciliated cells was significantly reduced in both study groups in both tubal segments (A, B). There was no statistical significant difference detected when the number of tubal ciliated cells was compared between fimbria and ampulla in the same group (C). Statistically significant differences were determined using the Mann-Whitney U test. N.S, no significance; ***P < 0.001.
