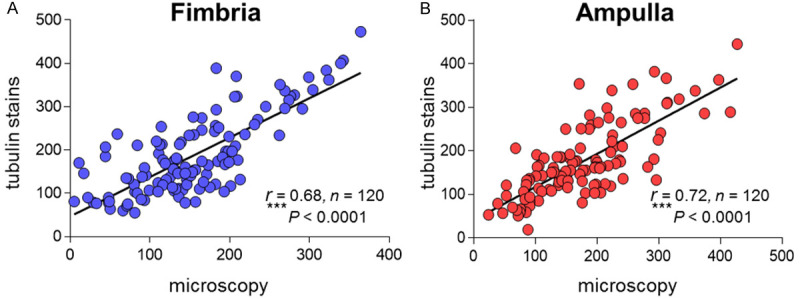
Figure 4.

Correlation of the number of tubal ciliated cells between the method of microscopic direct counting (HE) and the method with tubulin staining (IHC) from matched tubal tissue sections. A Robust correlation between the two methods was present. A. Ciliated cells distribution in tubal ampulla region; B. Ciliated cells distribution in tubal Ampulla region; Spearman rank correlation (r) was used for the correlation analysis; ***P < 0.001.
