
Figure 4.
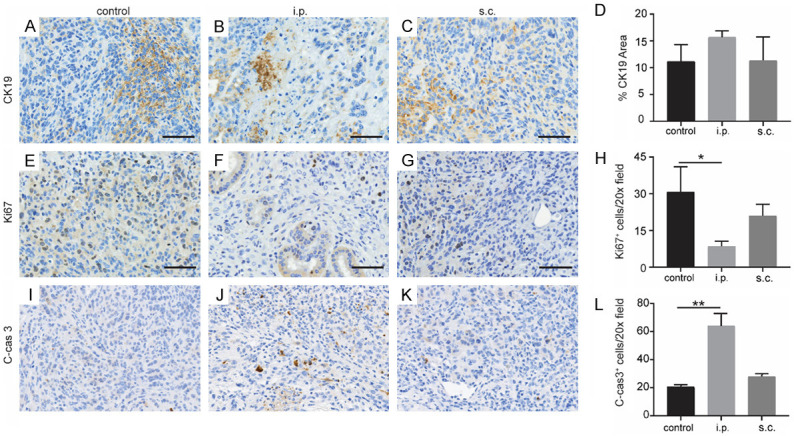
Tumor progression after different DC vaccination in KPC orthotopic mice. Representative IHC images of CK19 staining in KPC tumor from control group (A), i.p. vaccination group (B), and s.c. vaccination group (C). (D) Quantification of CK19 is shown (n = 5). Representative staining of Ki67 of tumor from control group (E), i.p. vaccination group (F), and s.c. vaccination group (G). (H) Quantification of Ki67 is shown. Representative staining of C-cas 3 of tumor from control group (I), i.p. vaccination group (J), and s.c. vaccination group (K). (L) Quantification of C-cas 3 is shown. n = 5. Scale bars = 50 μm. *P < 0.05, **P < 0.001. Data are expressed as the mean ± SEM.