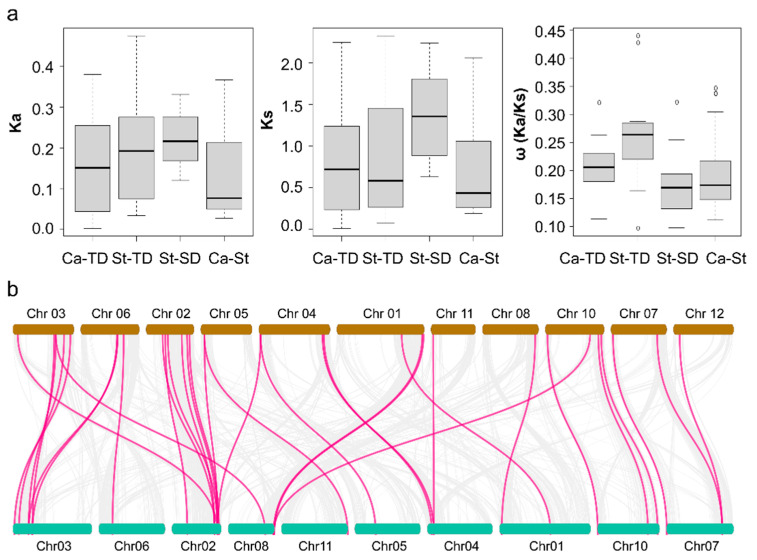
Figure 4.
Collinearity analysis of MATE genes between pepper and potato. (a) Average value of Ka, Ks, and ω (Ka/Ks ratio). The x-axis indicates tandem duplication (TD) events in pepper (Ca) and potato (St), segmental duplication (SD) events in potato, and collinear pairs between pepper and potato (Ca-St). The y-axis shows Ka, Ks and Ka/Ks ratios of MATE genes for each pair. Boxplots were generated in R. (b) The potato chromosomes are in brown (top) and pepper chromosomes in green (bottom). Putative orthologous genes in their genomes are connected by lines and were identified using MCScanX. The innermost grey solid lines show collinear relationships between MATE genes. We identified 30 orthologous MATE gene pairs, indicated by magenta lines.

