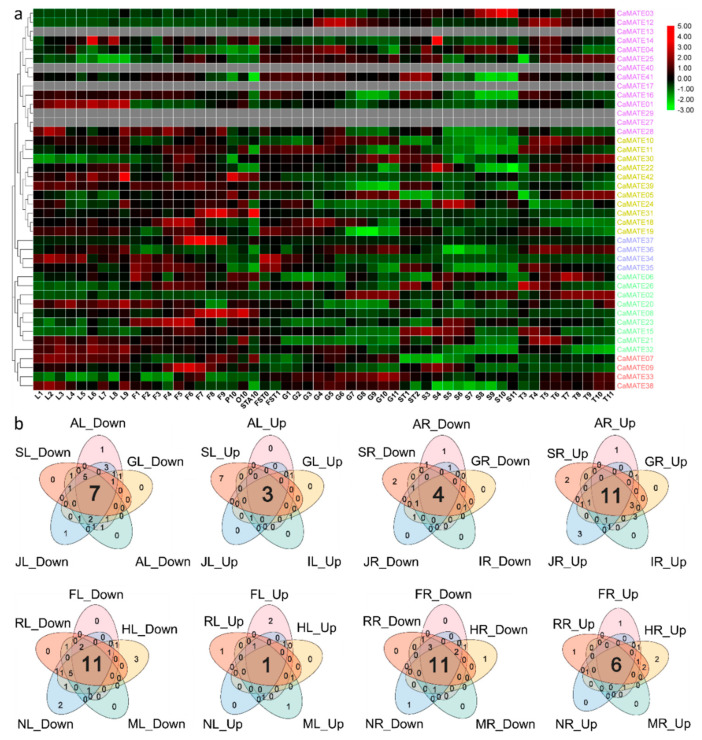
Figure 6.
Expression of pepper CaMATE genes during plant development and in response to various stresses. (a) Tissue-specific expression data for pepper CaMATE genes were obtained from published data (http://www.hnivr.org/pepperhub). Red and green colors represent higher and lower expression, respectively. Pepper samples: L: leaf, F: flower, P: petal, O: ovary, STA: anther, FST: whole fruit, G: pericarp, T: placenta, ST: placenta, and seed, S: seed. Heat map of the expression data for MATE genes in the selected 54 pepper tissues. The heat map with phylogenetic tree was drawn with R. (b) Venn diagrams of CaMATE expression in response to phytohormones and stress. A: ABA-treated; S: SA-treated; J: JA-treated; I: IAA-treated; G: GA-treated; F: freezing-treated; R: H2O2-treated; N: NaCl-treated; M: mannitol-treated; H: heat-treated; Up: up-regulated genes; Down: down-regulated genes. L: leaves; R: roots. The two-letter code lists the treatment first, then the tissue. The numbers given in the Venn diagram represent the numbers of up-/down-regulated genes.

