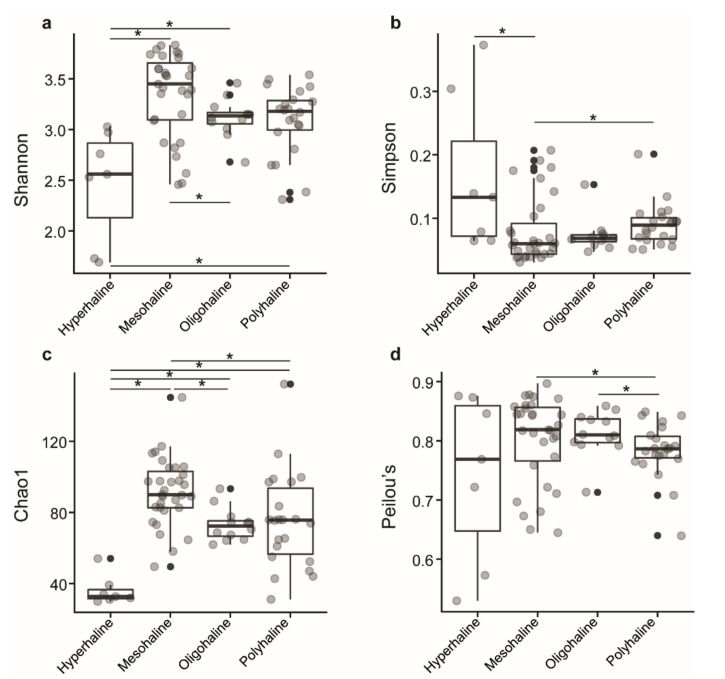
Figure 2.
Boxplot of alpha-diversity indices. (a) Shannon and (b) Simpson indices reflect the diversity of zOTUs in samples. (c) Chao1 and (d) Peilou’s indices reflect the zOTU abundance and evenness in samples. The greater the Shannon and Simpson indices, the higher the diversity of the microbiota in samples. The greater the Chao1 and Peilou’s indices, the higher the expected species richness and evenness of the microbiota; boxes represent the interquartile range (IQR) between the first and third quartiles (25th and 75th percentiles, respectively), and the horizontal line inside the box defines the median. Whiskers represent the lowest and highest values within 1.5 times the IQR from the first and third quartiles, respectively. “•“ indicates greater than 1.5 times and less than three times the IQR; Grey circles denote respective alpha diversity estimate values of lake samples grouped based on their salinity; “*”: significant difference was tested with the Kruskal–Wallis test, p < 0.05.

