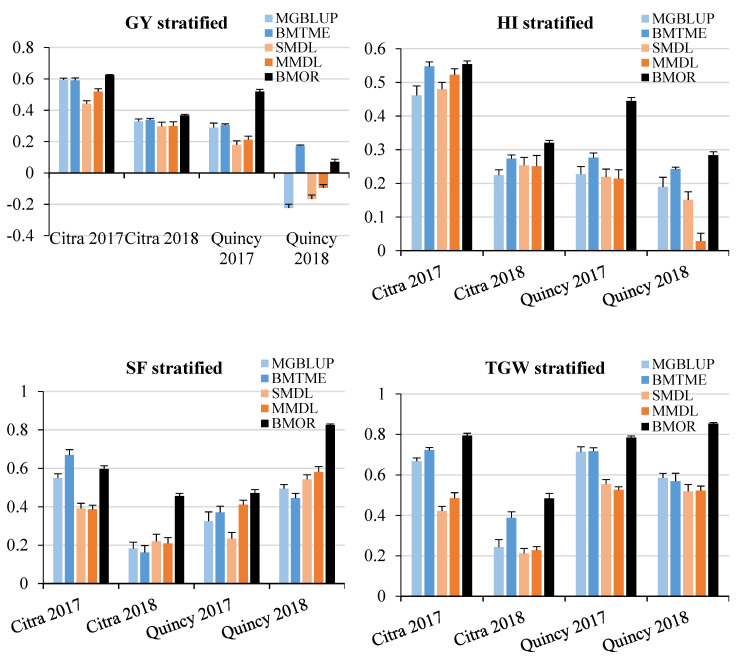
Figure 3.
Prediction accuracies for GY, HI, SF, and TGW with population stratified. GY, grain yield; HI, harvest index; SF, spike fertility; TGW, thousand grain weight. Mean Pearson’s correlations and standard errors for each environment were presented for each trait. Statistical models were colored in light blue and blue while DL models were colored in light orange and orange. The BMOR model is colored in black.

