
Figure 5.
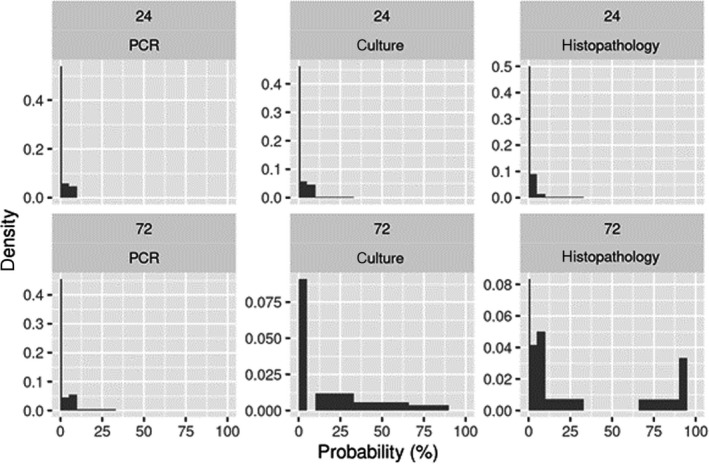
Distribution of NRL and EURL responses on the probability of observing a decrease in the sensitivity of each diagnostic test after a delay of 24 h (first row) or 72 h (second row)
First column: PCR, second column: culture; third column: histopathology.