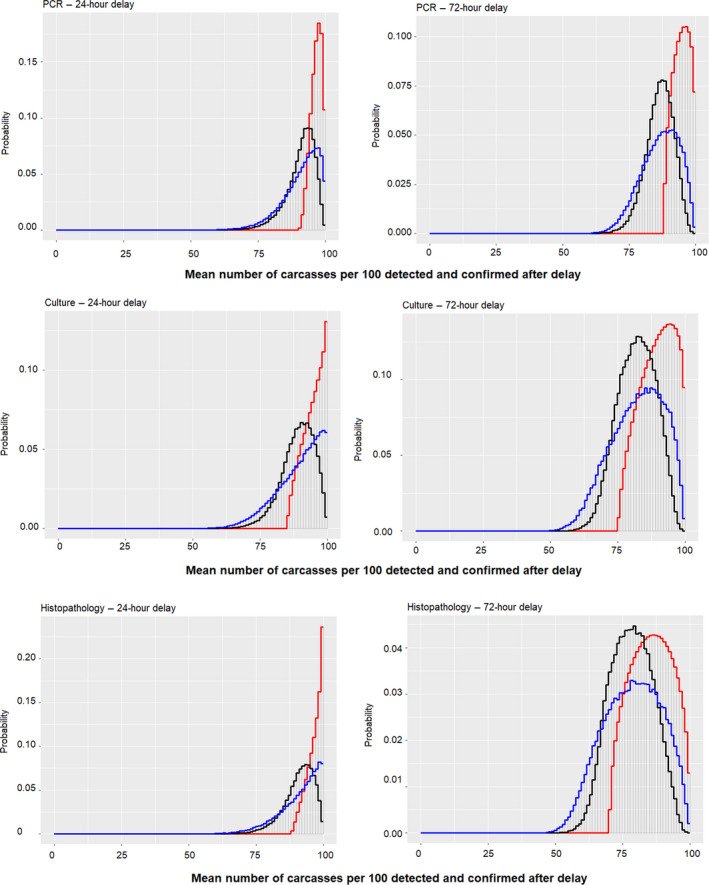
Figure 8.

Probability density functions of the estimates of the overall effect of a 24‐ or 72‐h delay on the efficacy of the PMI and laboratory tests to confirm bovine tuberculosis infection in comparison with the current procedure
- Black, blue and red lines represent scenario 1 (complete independence), scenario 2 (complete correlation) and scenario 3 (upper bound). The curve shows the overall judgement about the range and likelihood of values for the mean number of carcasses per 100 still detected and confirmed after 24 and 72 h using direct‐PCR, culture or histopathology as the laboratory confirmatory tests.
