Figure 16.

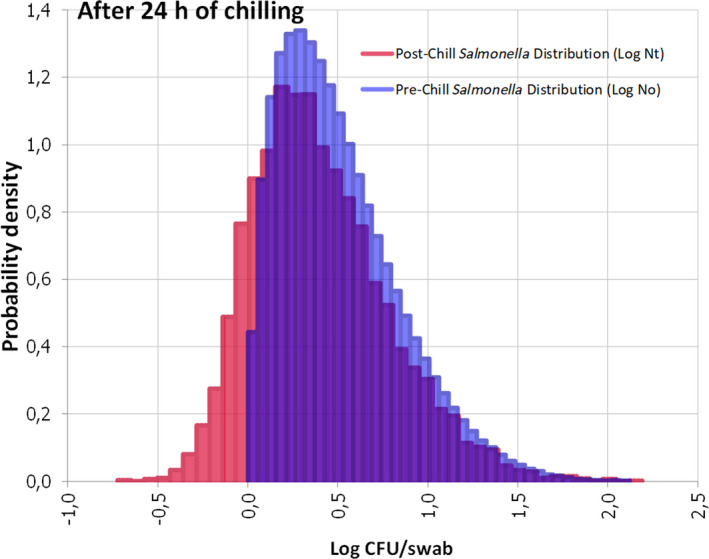
Pre‐ (blue = Log No) and post‐ (red = Log Nt) chill distribution of Salmonella levels at 24 h in samples where Salmonella is detected pre‐chill

Pre‐ (blue = Log No) and post‐ (red = Log Nt) chill distribution of Salmonella levels at 24 h in samples where Salmonella is detected pre‐chill