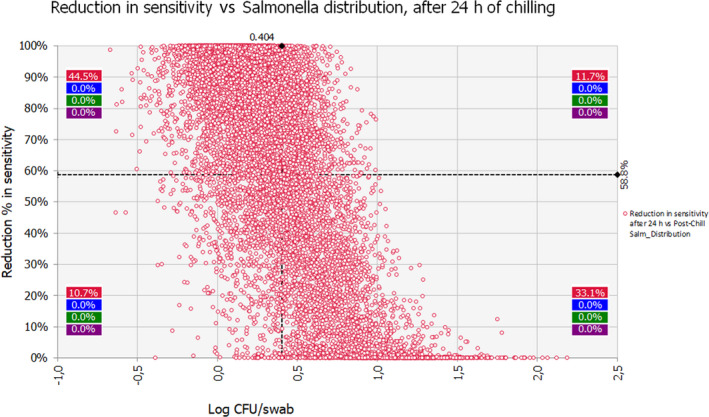
Figure 17.

Scatter plot of post‐chill viable and culturable Salmonella levels (Log Nt) detached from carcass and reduction (%) in Salmonella sensitivity
- Each dot represents a combination of a value from the post‐chill distribution of Salmonella concentration and the corresponding value from the uncertainty distribution of the % reduction in probability of Salmonella detection.
